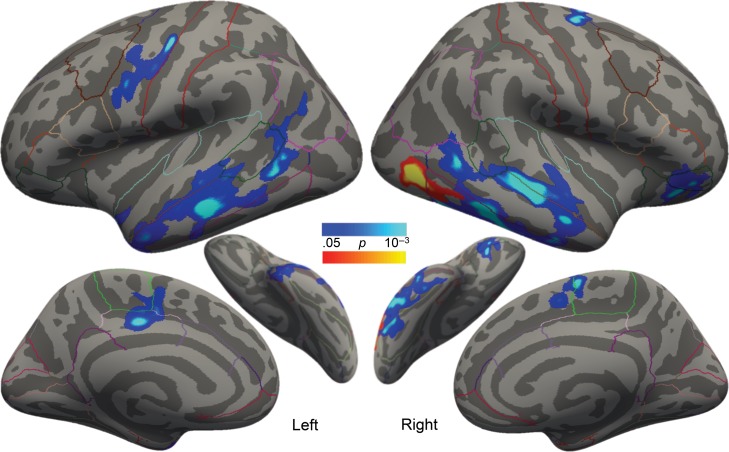
Figure 7.
Regions exhibiting significant correlations between changes in cortical thickness and SES (cool colors) or RD severity (warm colors) among all children who received intervention, controlling for gender. Outlines represent the cortical parcellations from the Desikan–Killiany gyral-based atlas.

