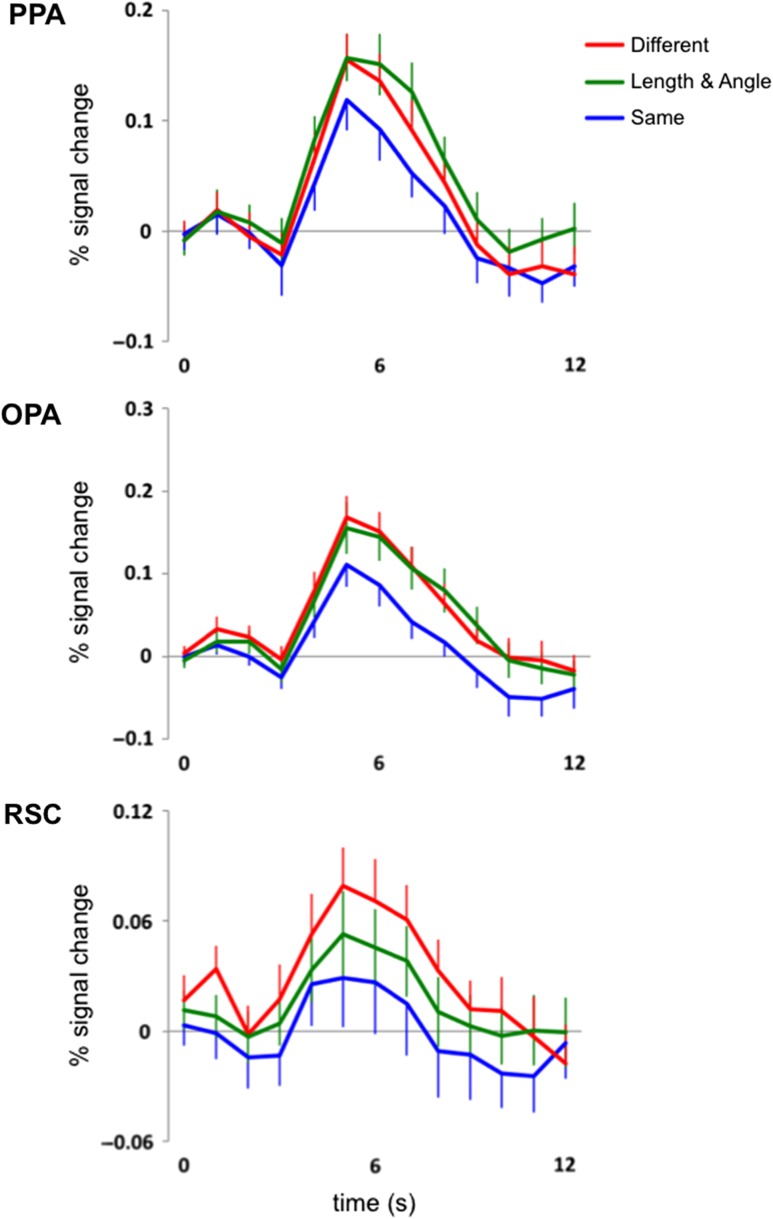
Figure 2.
Hemodynamic time courses (percent signal change) of 3 scene-selective regions of cortex, the PPA, the OPA, and the RSC to 2 completely different pictures of scenes (red line labeled “Different”), a scene picture followed by that same picture but with a change to both its relative length and angle properties (green line labeled “Length & Angle”), and the same picture of a scene presented twice (blue line labeled “Same”). Note that there is sensitivity to relative length and angle changes in both the PPA and the OPA, while the RSC is tolerant to such changes.

