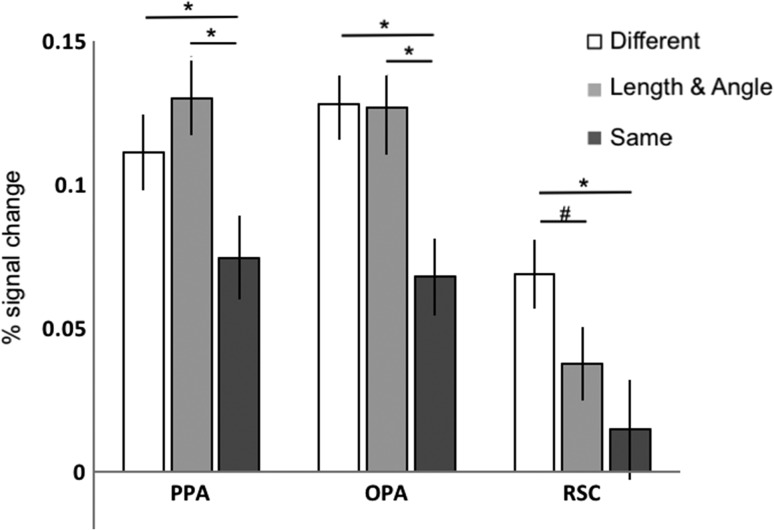
Figure 3.
The average response (percent signal change) from 5 to 9 s in the Different (white), Length and Angle (light gray bars), and Same (dark gray bars) conditions in each ROI, demonstrating that the PPA and the OPA are sensitive to changes in relative length and angle, while the RSC is tolerant to such changes. (*the difference is significant at P < 0.05, #the difference is marginally significant at P = 0.10.)

