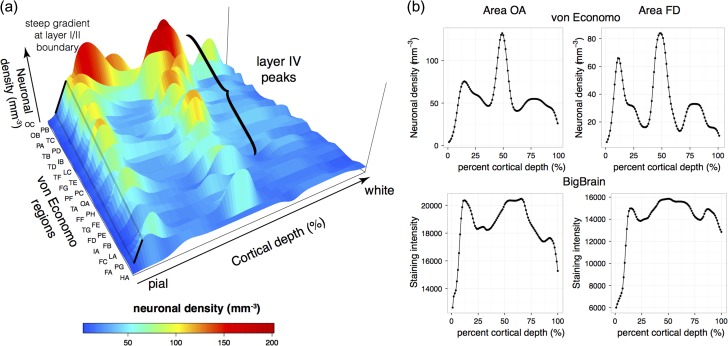
Figure 2.
Investigation of density profiles. (a) Cellular density profiles were created from areal measurements of thickness and neuronal density of each cortical layer reported by von Economo & Koskinas (von Economo and Koskinas 1925). The first letter of each areal code corresponds to the lobe, the second letter indicates successive lobar measurements e.g., OA, occipital area A, TB, temporal area B, etc. All von Economo profiles exhibited a large positive gradient between layer I, which has the lowest neuronal density, and layer II. Most profiles also exhibited a consistent mid-profile peak corresponding to high neuronal density in layer IV. A notable exception included FA, the agranular motor cortex, so called because no granular layer is visible under a microscope. (b) von Economo density profiles were compared with intensity profiles from corresponding areas in the BigBrain. Shown here are von Economo areas OA (extrastriatal occipital cortex) and FD (granular anterior frontal cortex). The layer I/II boundary and mid-cortical layer IV peak is consistently present in both von Economo and BigBrain profiles.

