Figure 1.
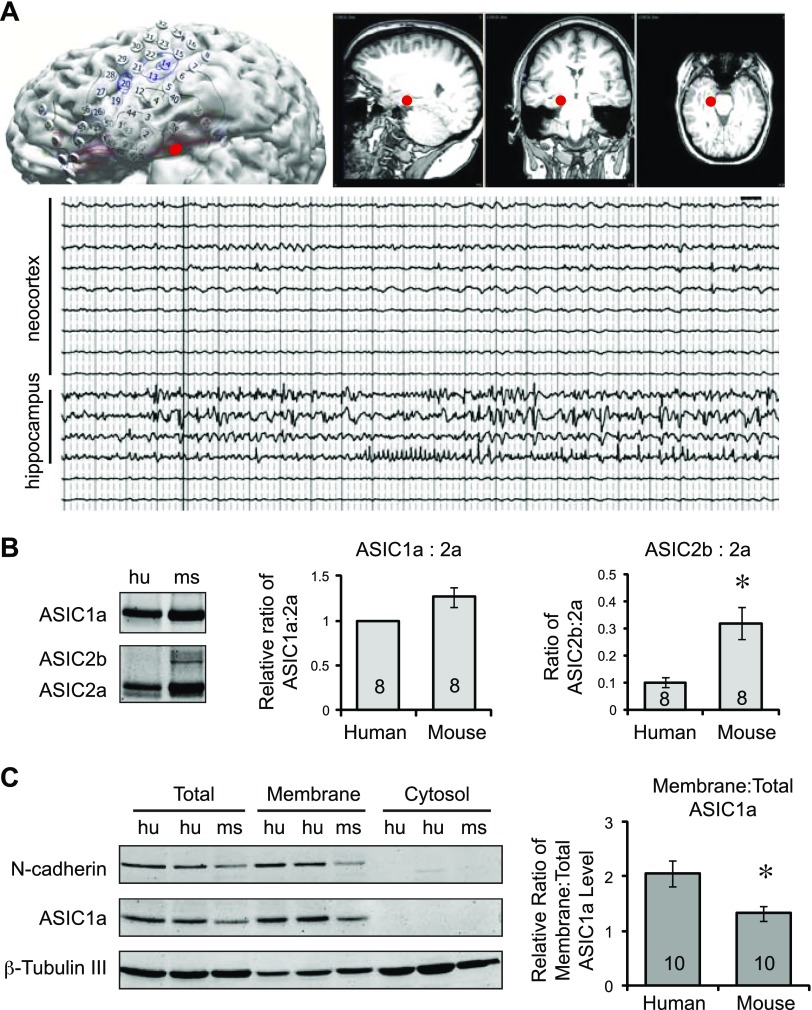
Expression of ASIC1 and -2 in human cortical tissue. A) A typical set of images and traces showing the identification of epileptic foci in 1 patient. Diagram illustrates the layout of the recording electrodes (top left), whereas the MRIs on the right illustrate the location of the epileptic foci (indicated by a red dot) in hippocampus. EEG traces from neocortex and hippocampus: hippocampus exhibited epileptic patterns of activities, which were absent in cortical traces (bottom). Note that the cortical samples were used in this study for comparing ASIC expression between human and mouse brain. B) Representative Western blot images and quantification showing the expression of ASIC1a, -2a, and -2b in human (hu) and mouse (ms) cortical tissues (left). Acutely resected human cortical tissues were obtained, as described in Materials and Methods. Human and mouse cortical tissues were blotted for ASIC1 and ASIC2, which recognize both ASIC2a and -2b. Antibody specificity was verified using the corresponding ASIC knockouts (14, 21). Human and mouse tissues were not statistically different in the relative ratio of ASIC1a:ASIC2a (P > 0.05, either by Student’s t test or Wilcoxon signed rank test) (middle). The relative ASIC2b:ASIC2a ratio was significantly lower in human tissue. P = 0.006 (Student’s t test) (right). C) Representative Western blot images and quantification showing ASIC1a levels in membrane (left). Membrane fractions from human and mouse cortical tissues were prepared, as described in Materials and Methods. Total lysate, membrane fraction, and cytosol fraction were blotted for ASIC1a, N-cadherin, and β-tubulin III. The latter 2 proteins served as controls for the quality of the preparation. Right: quantification of relative membrane:total ASIC1a ratios. Asterisks (B, C) indicate significant differences between mouse and human. Numbers in bars indicate number of repeats.

