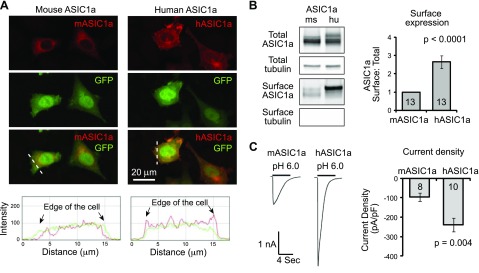
Figure 2.
hASIC1a shows higher surface expression than mASIC1a. A) Representative confocal images showing distribution of mASIC1a and hASIC1a in CHO cells (top). CHO cells were transfected with mASIC1a or hASIC1a (red), together with eGFP. ASIC1a localization was visualized by immunofluorescence using an anti-ASIC1a antibody. Plots show the line profile of ASIC1a (red) and eGFP (green) along the dashed lines, as indicated (bottom). Note that hASIC1a exhibited a higher signal at the edge of the cell. B) Representative Western blot images showing surface and total levels of ASIC1a (left). CHO cells expressing mASIC1a and hASIC1a were surface biotinylated, followed by pulldown of surface fraction with NeutrAvidin beads (see Materials and Methods). Total and surface fractions were blotted with ASIC1a and tubulin at the same time. Quantification of surface:total ratio of ASIC1a (right). Numbers in bars indicate the number of repeats. C) Representative traces and quantification of pH 6-activated current density of CHO cells expressing mASIC1a or hASIC1a. Numbers in bars indicate the number of cells.

