Figure 6.
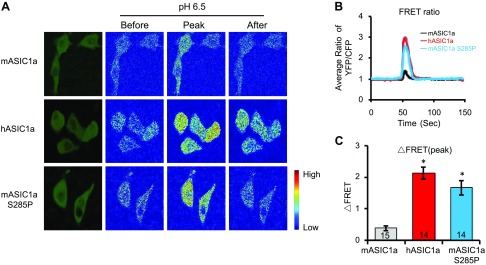
hASIC1a and mASIC1a S285P elicit a larger acid-activated calcium increase. CHO cells were transfected with various ASIC1 constructs, as indicated together with cameleon YC3.60, a ratiometric calcium reporter. FRET imaging and spectral unmixing were performed, as described in Materials and Methods. A) Representative images showing the fluorescent images of transfected cells (leftmost) and ratiometric images (right 2 sets) before, at peak, and after stimulation with a pH 6.5 solution. For ratio images, red and blue indicate high and low FRET, respectively. B) Average time-dependent changes in FRET (YFP/CFP ratio) of cells expressing mASIC1a, hASIC1a, and mASIC1a S285P. C) Quantification of peak change in FRET (ΔFRET) of cells expressing the 3 different constructs. Bar numbers indicate total number of cells analyzed (B, C). Asterisk indicates differences from mASIC1a (ANOVA). Numbers in bars indicate number of repeats.

