Figure 7.
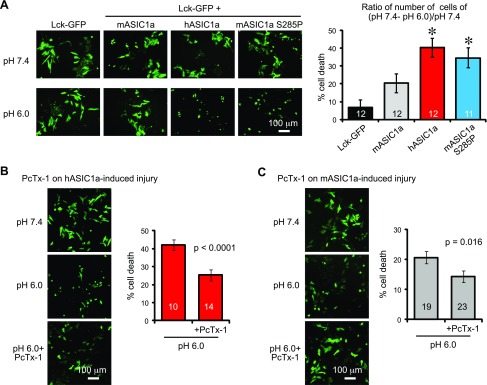
Cells expressing hASIC1a exhibit increased acidotoxicity. A) Left: representative images showing the effect of acidotoxicity in cells expressing Lck-GFP alone or together with mASIC1a, hASIC1a, or mASIC1a S285P. CHO cells were transfected with the above constructs for 2 d and treated with pH 7.4 or 6.0 for 2 h. Approximately 24 h after the treatment, GFP+ cells were visualized and counted. Bar graph shows quantification of cell death after 2 h pH 6 treatment (right). Cell death was calculated by subtracting the number of cells in pH 6 from that in pH 7.4. Asterisk indicates difference from the vector control (Lck-GFP). The hASIC1a group was also significantly higher than the mASIC1a group. P < 0.05 (ANOVA). Numbers in bars indicate number of repeats from 9 separate experiments. B, C) Representative images and quantification showing the effect of PcTx-1 on acidosis-induced injury in cells expressing hASIC1a (B) or mASIC1a (C). PcTx-1 was used at 100 ng/ml. Numbers in bars denote number of repeats from 4 (hASIC1a) or 9 (mASIC1a) separate experiments. Significance value resulted from 1-tailed Student’s t test.

