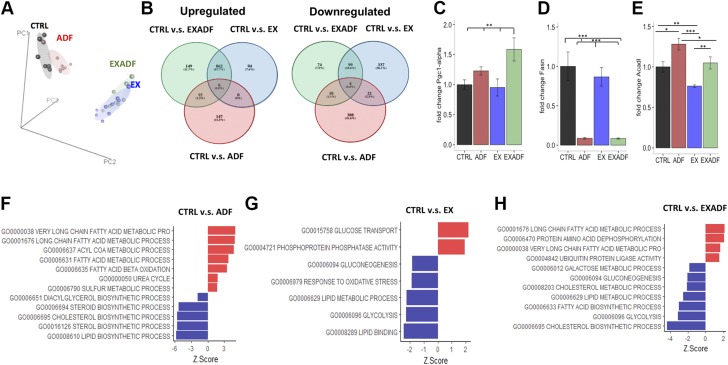
Figure 7.
Impact of treadmill running and ADF on liver transcriptome. A) PCA of liver gene microarray data reveals that liver transcriptomes of mice in EX and EXADF groups closely overlap and are distinct from transcriptomes of mice in CTRL and ADF groups. B) Venn diagrams of up-regulated and down-regulated gene transcripts present in CTRL-ADF, CTRL-EX, and CTRL-EXADF pairwise comparisons. C–E) PGC-1α, FASN, and ACADL mRNA levels analyzed by qPCR, normalized to actin, and displayed as relative fold change compared to CTRL group. Values are means ± sem (n = 7 CTRL, n = 8 ADF, n = 9 EX, and n = 8 EXADF mice). *P < 0.05, **P < 0.01, ***P < 0.001. F–H) Top metabolic GO pathways exhibiting differences between mice in CTRL groups and mice in ADF, EX, and EXADF groups (ranked by z-score values).

