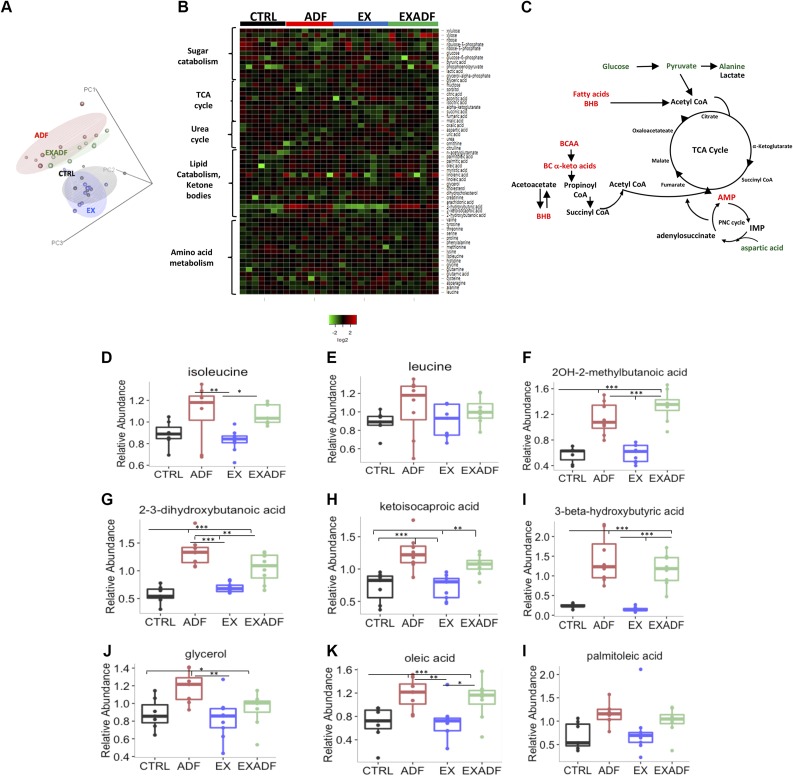
Figure 8.
Impact of treadmill running and ADF on plasma metabolome. A) PCA of plasma metabolomics data reveals that metabolomes of mice in ADF and EXADF groups closely overlap and are distinct from metabolomes of mice in CTRL and EX groups. B) Heat map showing relative levels of major metabolites in each of indicated pathways from each mouse in each group. C) Diagram showing metabolites feeding into TCA cycle that are either elevated (red) or reduced (green) in mice in ADF and EXADF groups compared to CTRL group. BCAA, branched chain amino acids; CoA, coenzyme A; IMP, inositol monophosphate; PNC, purine nucleotide cycle. D, E). Relative concentrations of ketogenic amino acids isoleucine and leucine in plasma of mice in 4 different groups. F–H) Relative concentrations of branched-chain α-keto acids plasma of mice in 4 different groups. I) Relative concentrations of ketone β-hydroxybutyrate in plasma of mice in 4 different groups. J–L) Relative concentrations of fatty acid metabolites glycerol, oleic acid, and palmitoleic acid in plasma of mice in 4 different groups. Values are means ± sem (n = 7 CTRL, n = 8 ADF, n = 9 EX, and n = 8 EXADF mice). *P < 0.05, **P < 0.01, ***P < 0.001.

