Figure 6.
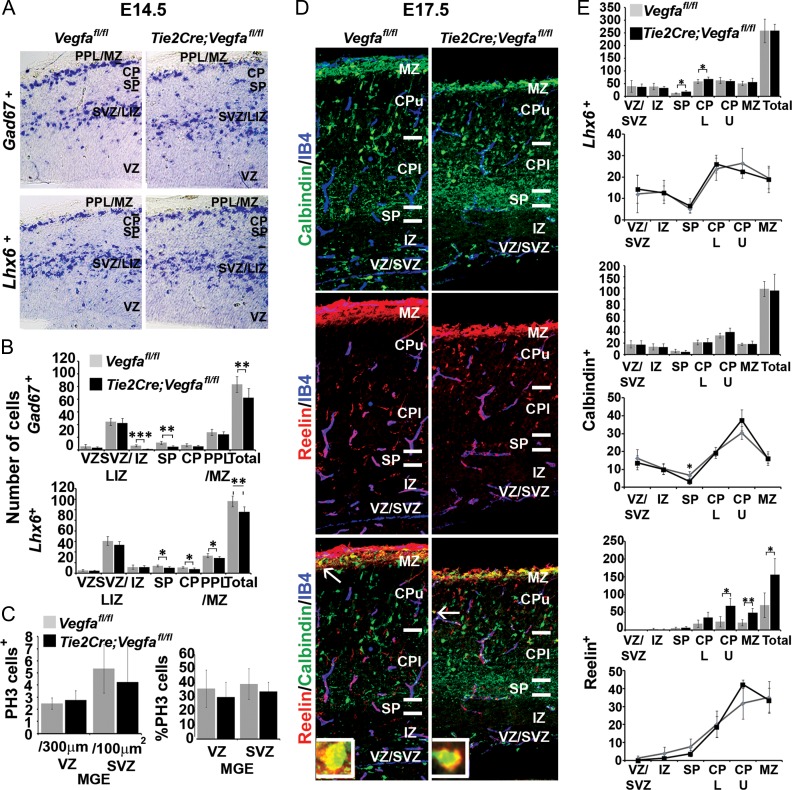
Decreased cortical interneuron numbers and alterations in their intracortical distribution in Tie2Cre;Vegfafl/fl mutant forebrains. (A) In situ hybridization for the Gad67 and Lhx6 mRNA in the cortex of E13.5 Vegfafl/fl control (gray) and Tie2Cre;Vegfafl/fl mutant (black) and their (B) quantifications in cortical regions (Student’s t-test; n = 4 when combining n = 2 at E13.5 combined with n = 2 E14.5; *P ≤ 0.05, **P ≤ 0.01, ***P ≤ 0.001). (C) Graphs show mean total numbers and percentages of PH3+ proliferating MGE progenitors in the E13.5/E14.5 Vegfafl/fl control and Tie2Cre;Vegfafl/fl mutant animals (Student’s unpaired t-test, n = 4 when combining n = 2 at E13.5 combined with n = 2 E14.5; *P ≤ 0.05, **P ≤ 0.01, ***P ≤ 0.001). (D) Immunolabelling of Calbindin+ and Reelin+ cells and IB4+ blood vessels, in the cortex of E17.5 Vegfafl/fl and Tie2Cre;Vegfafl/fl mutant mice with (E) their total numbers and intracortical distributions represented graphically. (Student’s unpaired t-test, n = 3 for each; *P ≤ 0.05, **P ≤ 0.01) (Graphs show mean values ±SEM).

