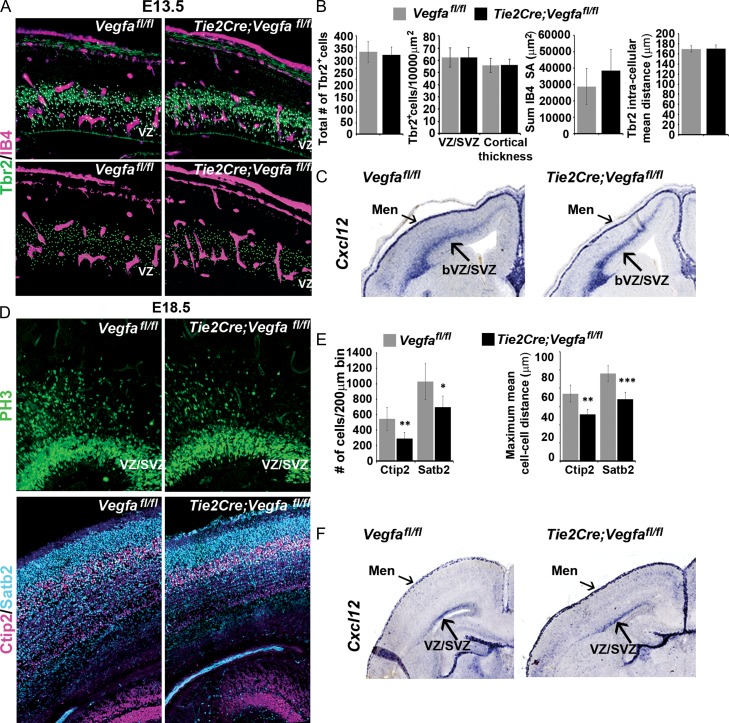
Figure 7.
Unaltered number and density of intermediate progenitors or in their expression of Cxcl12/Sdf1 in E13.5 Tie2Cre;Vegfafl/fl mutant forebrains. (A) Images of the dorsal cortex of E13.5 Vegfafl/fl control and Tie2Cre;Vegfafl/fl mutant forebrains immunostained for Tbr2+ intermediate progenitor cells (IPCs) and with the vasculature labeled with isolectin-B4. Spots superimposed on Tbr2+ nuclei show automated detection of Tbr2+ cells using Imaris software spot module function, with spots in bottom panels showing the distribution of Tbr2+ cells and surface rendering of the vasculature used in quantifications shown in bar charts. (B) Graphs show the total number (left) and density of Tbr2+ cells within the neurogenic basal VZ/SVZ and normalized for differences in cortical thickness in E13.5 Vegfafl/fl control and Tie2Cre;Vegfafl/fl mutant forebrains (second left). Graphs on right shows the surface area of IB4+ blood vessels in the cortex of E13.5 Vegfafl/fl control and Tie2Cre;Vegfafl/fl mutant measured from surface renderings generated with Imaris software and the mean intra-cellular distance of Tbr2+ cells. (C) In situ hybridization analysis of Cxcl12/Sdf1 transcripts in the E13.5 Vegfafl/fl control and Tie2Cre;Vegfafl/fl mutant forebrains. (D) Immunolabelling of Tbr2+ IPs (top panels), Ctip2+ and Satb2+ pyramidal neurons (bottom panels) in the dorsal cortex of E17.5 Vegfafl/fl control and Tie2Cre;Vegfafl/fl mutant forebrains with (E) bar charts showing the mean total numbers and intercellular distances of Ctip2+ and Satb2+ cells. (F) Expression of Cxcl12/Sdf1 transcripts in the E17.5 Vegfafl/fl control and Tie2Cre;Vegfafl/fl mutant forebrains (t-test, *P ≤ 0.05, **P ≤ 0.01, ***P ≤ 0.001) (Bar graphs show mean values ±SEM).

