Figure 8.
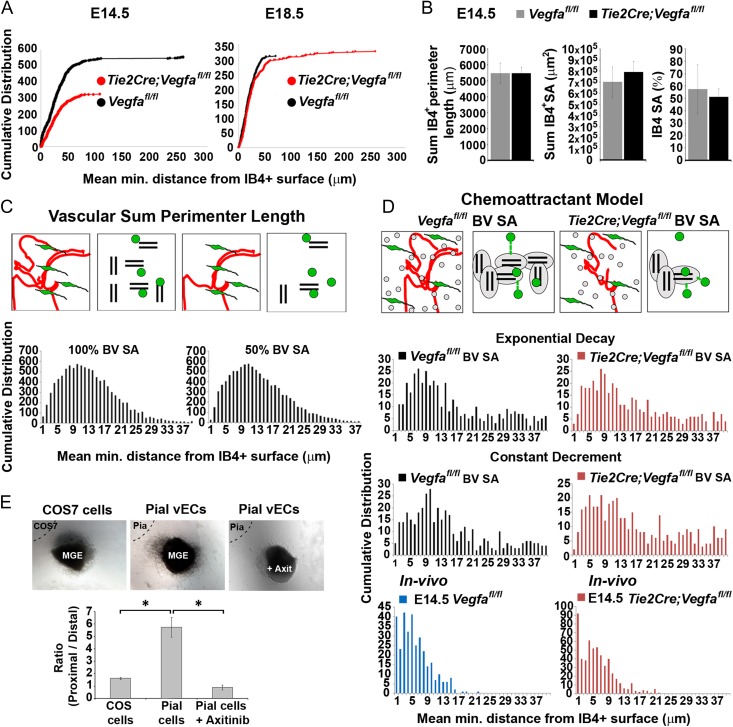
Decreased proximity of migrating cortical interneurons with the vasculature upon endothelial depletion of Vegfa (A) Cumulative distribution showing all measurements of mean minimum distances between the centroid of Calbindin+ interneurons and the closest IB4+ vascular surface in E14.5 and E18.5 Vegfafl/fl control and Tie2Cre;Vegfafl/fl mutant cortex (E14.5, Vegfafl/fln = 368 cells, Tie2Cre;Vegfafl/fl, n = 476 cells; E18.5, Vegfafl/fln = 311 cells, Tie2Cre;Vegfafl/fl, n = 327 cells) (KS-test, P ≤ 0.001 for all, maximum difference between cumulative distributions (D) at E13.5, D is 0.1294; E14.5, D is 0.1470; E18.5, D is 0.1698). (B) Automated measurements of the sum perimeter lengths, surface area and % surface area occupancy of IB4+ periventricular (PVP) and perineural (PNP) vascular plexi in the E14.5 Vegfafl/fl and Tie2Cre;Vegfafl/fl cortex. (C) Schematics show how the in vivo representations of blood vessels and interneurons (left panels) were modeled by pairs of lines and spots, respectively (right panels). Both objects were randomly distributed in a 3D volume space and the mean minimum intra-object distances calculated in the same manner as when analyzing the in vivo interneuron-vascular distributions. Graphs show how changing blood vessel (BV) surface area (SA) influences the relative distributions of interneurons with vascular surfaces when these are randomly distributed. (D) Schematic representation of in vivo and simulated representations of blood vessels (red lines) and interneurons (green cells) in vascular-chemoattraction models; in which chemoattraction was modeled as an exponential decay or as a constant decrement. Graphs show mean minimum distances measured between simulated interneurons (spots) and blood vessels (lines) in vascular chemoattraction exponential decay or constant decrement models. Magenta bar charts show the same simulations in which the vascular surface area is reduced by 30% to simulate the decreased vascular surface area observed in the Tie2Cre;Vegfafl/fl in vivo. Bottom bar charts show in vivo mean minimum distances measured between the centroid of Calbindin+ interneurons with the closest IB4+ vascular surface in the Vegfafl/fl animals (blue) and Tie2Cre;Vegfafl/fl mutants (magenta) using the bespoke plugin. (E) E15.5 rat MGE explants cocultured with cortical pial explants dissected from the same forebrain, or with control COS cells, in the presence/absence of the VegfR1-R3 inhibitor Axitinib (n = 3 experiments) (t-test, *P ≤ 0.05) (Bar graphs show mean values ±SEM).

