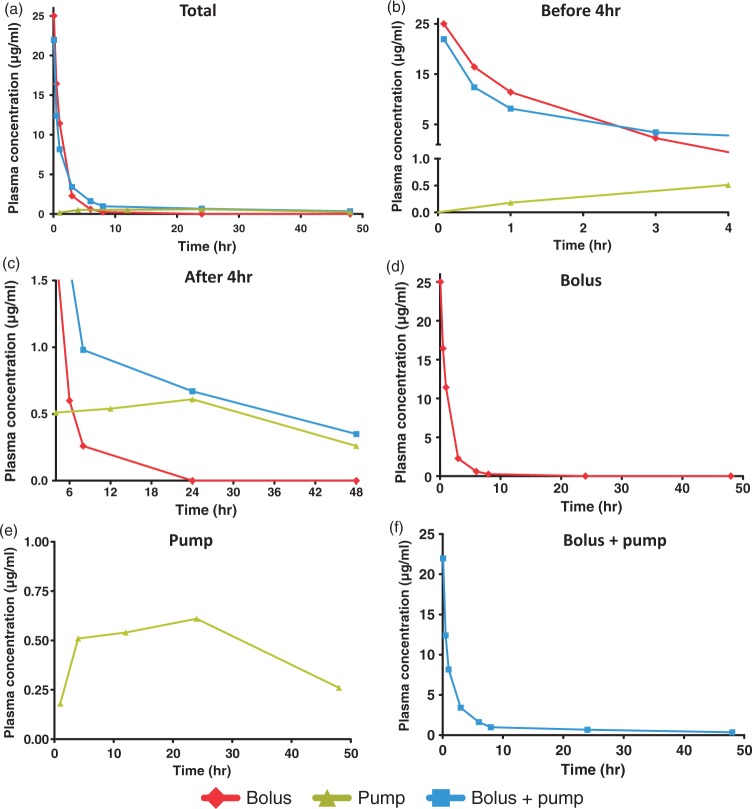
Figure 2.
Plasma-time concentration curves. Rats received either IV bolus (25 mg/kg), SC pump infusion (1 mg/kg/h for 48 h) or both. Plasma concentrations were measured by HPLC-MS/MS between T0 and T 48 h. Plasma-time concentrations curves of (S)-roscovitine are represented for Bolus (n = 3), Pump (n = 3) and Bolus + pump (n = 6) between T0 and T 48 h (a). Curves are zoomed before T 4 h (b) and after T 4 h (c). The plasma-time concentration curves are also independently represented for (d) Bolus, (e) Pump and (f) Bolus + pump. Data are expressed as means of three to six independent values.

