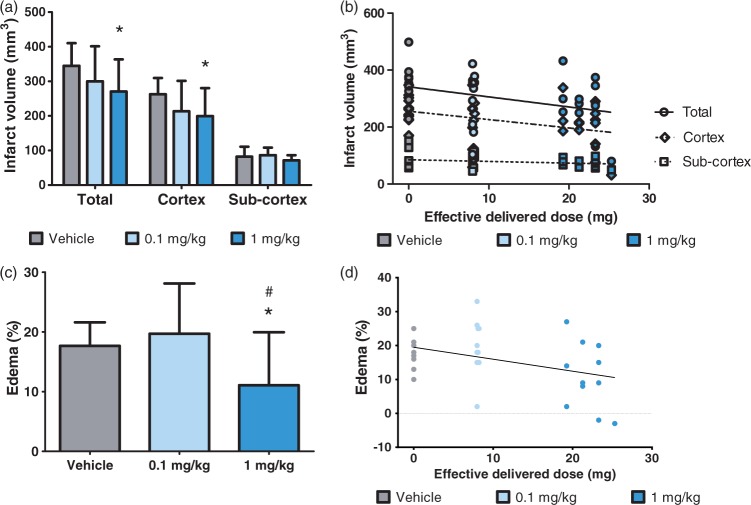
Figure 5.
Dose-dependent neuroprotective effect on infarct volume and brain edema. Brain lesions were measured by TTC staining 48 h post-MCAo. Figures show (a) the mean corrected infarction volumes and (c) edema measured as the percentage size of the contralateral hemisphere in the vehicle control group (n = 12) and (S)-roscovitine treatment groups: 0.1 mg/kg (n = 10) and 1 mg/kg (n = 13). Data are expressed as means ± SD. Data were analyzed by Student’s unpaired t-test. Signs indicate values different from vehicle: *p < 0.05 and different from 0.1 mg/kg: #p < 0.05. Figure (b) shows a negative correlation between infarct volume and the effective delivered dose in the total brain, cortex or subcortex. Pearson’s correlation coefficients: total brain: r = −0.376, r2 = 0.142, p = 0.03; cortex: r = −0.369, r2 = 0.137, p = 0.03; subcortex: r = 0.251, r2 = 0.063, p = 0.15 (N.S.). Figure (d) shows a negative correlation between edema and the effective delivered dose. Pearson’s correlation coefficient: r = −0.420, r2 = 0.177, p = 0.01.

