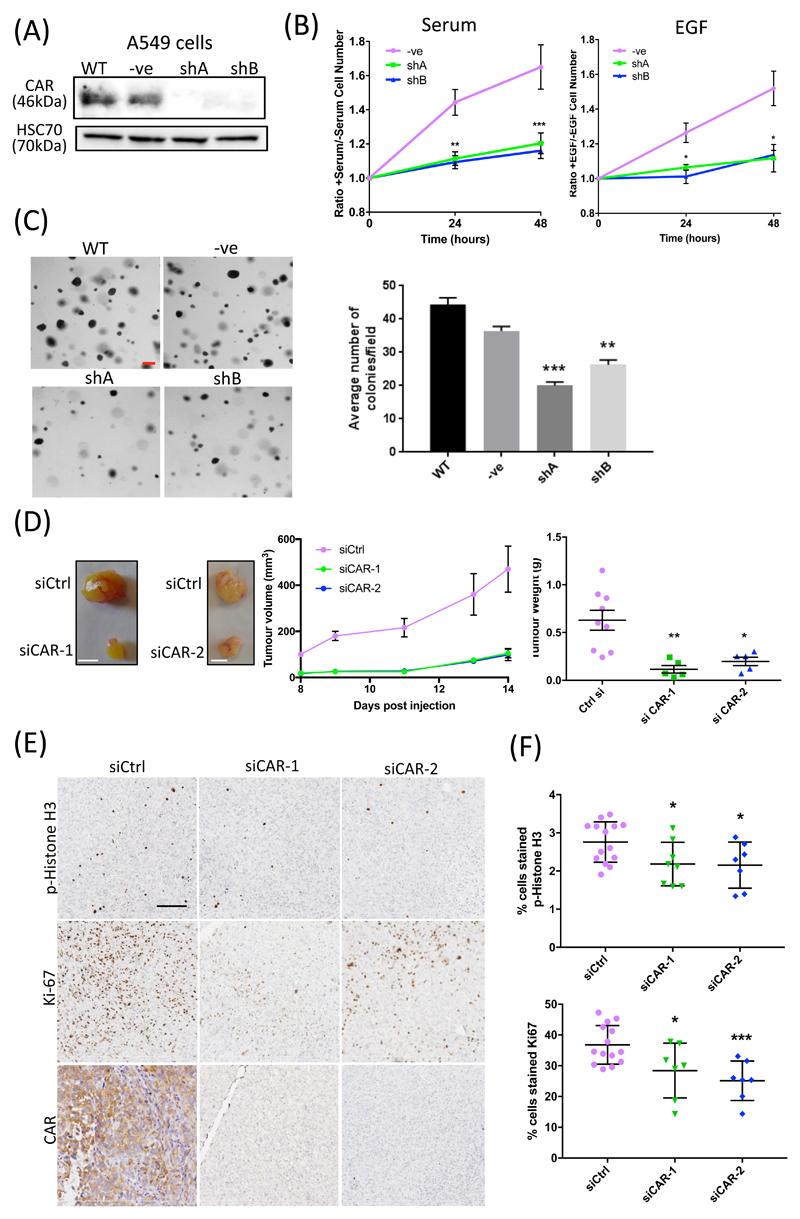
Figure 1. CAR regulates lung cancer cell proliferation in vitro and in vivo.
(A) Western blot of CAR KD in A549 cells, either untransfected (WT) or transfected with control shRNA (-ve) or one of two shRNA sequences targeting CAR (shA and shB). (B) A549 cell proliferation over 48 hours in response to serum (left) or EGF (10 ng/ml; right). Data is normalized to serum-free control samples for both. Data are from 3 independent experiments. (C) Left: Representative images (left) and analysis (right) of agar colony growth assays in A549 control or CAR KD cells (shA, shB). Scale bars are 100µm. Data are average number of colonies per field in all cells from 10 fields per cell line, and are representative of 3 independent experiments. (D) Representative images of resected tumours from xenograft models using H1975 control or CAR KD cells. Graphs on right show tumour volume and weight over time in 9 (control), 5 (siCAR1) or 5 (siCAR2) mouse models, pooled from two independent experiments. (E) Example images of phospho-HistoneH3 (top) and Ki-67 (bottom) staining in xenograft tissues from H1975 cell tumours in (D). Scale bars are 50µm. (F) Analysis of the p-Histone H3 and Ki-67 staining in xenografts represented in (E). N≥12 tumours per condition over 2 independent experiments. Data in all graphs are mean ± SEM. *p<0.01, **p0.005 by 2-way ANOVA.

