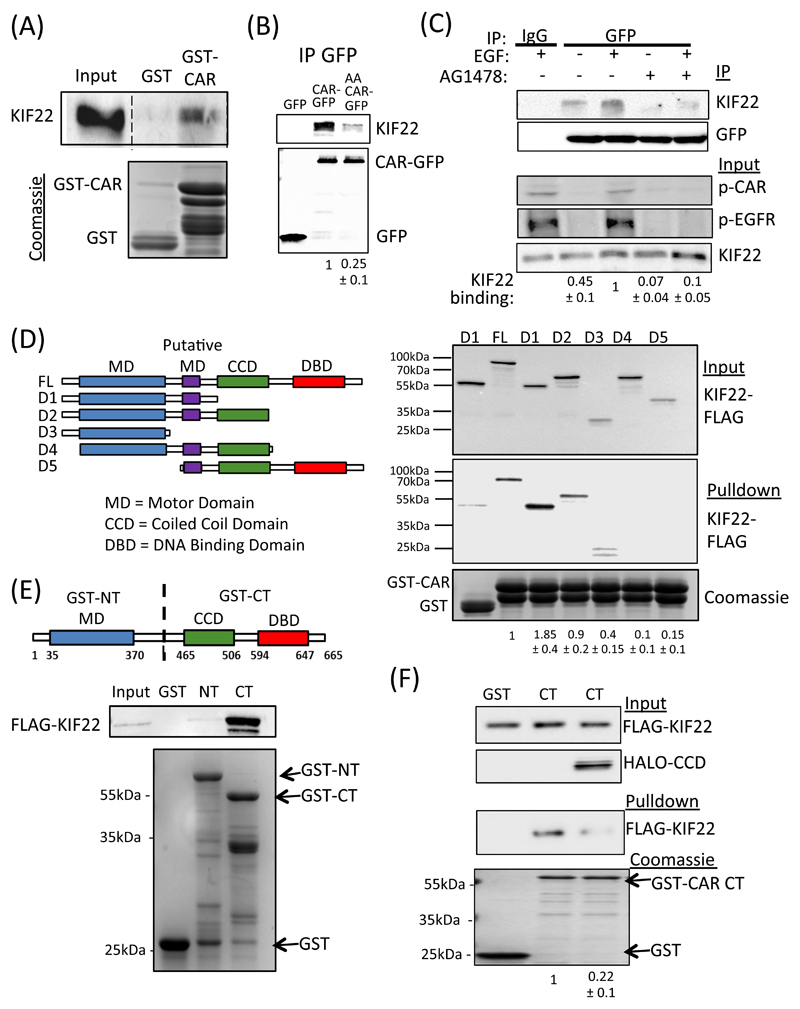
Figure 4. CAR binds to KIF22.
(A) Representative blot of pulldowns using GST-tagged cytoplasmic domain of CAR incubated with lysates from A549 cells and probed for KIF22. GST alone was used a control. Bottom gel is Coomassie-stained equivalent gel showing input. (B) Representative blots of A549 cells expressing GFP, WT CAR-GFP or AA CAR-GFP and subjected to GFP immunoprecipitation. Blots were probed for KIF22 or GFP as indicated. (C) A549 cells expressing CAR-GFP were serum-starved (-) or EGF-stimulated (15min, 10 ng/ml; +) in the presence or absence of AG1478 and subjected to GFP IP followed by probing for specified proteins. Top two panels show IP complexes, bottom three panels show input lysates. Quantification of KIF22 levels in IP complexes below blots are mean values from 3 independent experiments ± SEM. (D) Schematic cartoon of FLAG-tagged KIF22 constructs used for binding analysis. Right panel shows representative levels of KIF22-FLAG binding to GST-CAR cytoplasmic domain after pulldown from transfected HEK293 cell lysates. Coomassie-stained gel at bottom shows protein input. Quantification of KIF22 binding is provided beneath and represent mean values from 4 independent experiments ± SEM. (E) Schematic cartoon of GST-tagged N-terminal and C-terminal KIF22 constructs used for pulldowns. Blots beneath show representative results from pulldowns of KIF22-FLAG-expressing HEK293T cell lysates using N- or C-GST-KIF22. Data are representative of 5 independent experiments. (F) Representative blots from GST-tagged KIF22 C-terminal pulldowns from cell lysates expressing KIF22-FLAG in the presence or absence of co-expressed KIF22-CCD-HALO. GST was used as a control. Coomassie-stained gel at bottom shows protein input. Values beneath show levels of KIF22-FLAG in pulldowns and represent mean values from 3 independent experiments ± SEM. All data was analyzed for statistical differences using 2-way ANOVA.

