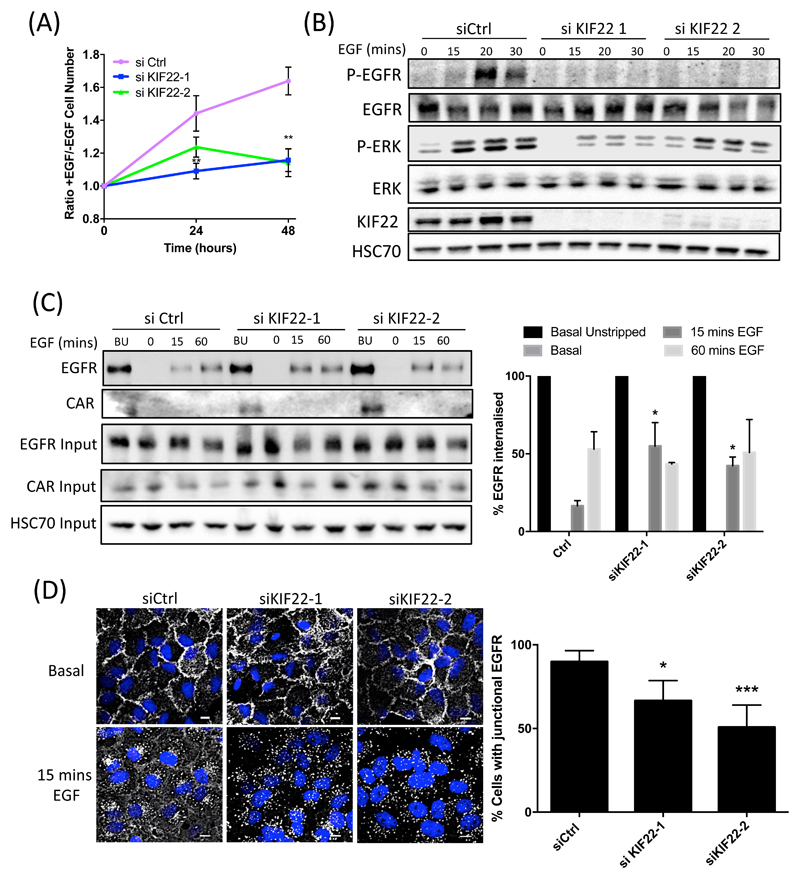
Figure 5. KIF22 promotes EGFR retention at plasma membrane and signalling in response to EGF.
(A) Analysis of the proliferation of A549 cells transfected with control or one of two KIF22-targeted siRNAs and treated with EGF, quantified relative to serum-starved control cells. Data are mean ± SEM. **p<0.005. (B) Representative blots of lysates from control or KIF22-KD A549 cells treated with EGF over the specified time periods and probed with the specified antibodies. (C) Representative blots of surface biotinylation experiments showing the amount of surface EGFR (basal unstripped; BU) and internalized EGFR after 0, 15 and 60 mins EGF (10 ng/ml) in control or KIF22-KD A549 cells. Blots were probed with specified antibodies. Data in graph, right, were normalized to basal unstrapped (black bars) and are presented as mean ± SEM from 4 independent experiments. *=p<0.01 vs equivalent time point in Ctrl samples. (D) Representative images of control or KIF22-KD A549 cells, either untreated or after stimulation with EGF (10 ng/ml for 15 mins), fixed and stained for DAPI (blue) and EGFR (white). Scale bars are 10um. Graph on right shows quantification of junctional EGFR levels after stimulation with EGF. Data are mean ± SEM from 30 cells across 3 independent experiments. *p<0.01, ***p<0.001. All data analyzed for statistical differences using 2-way ANOVA.

