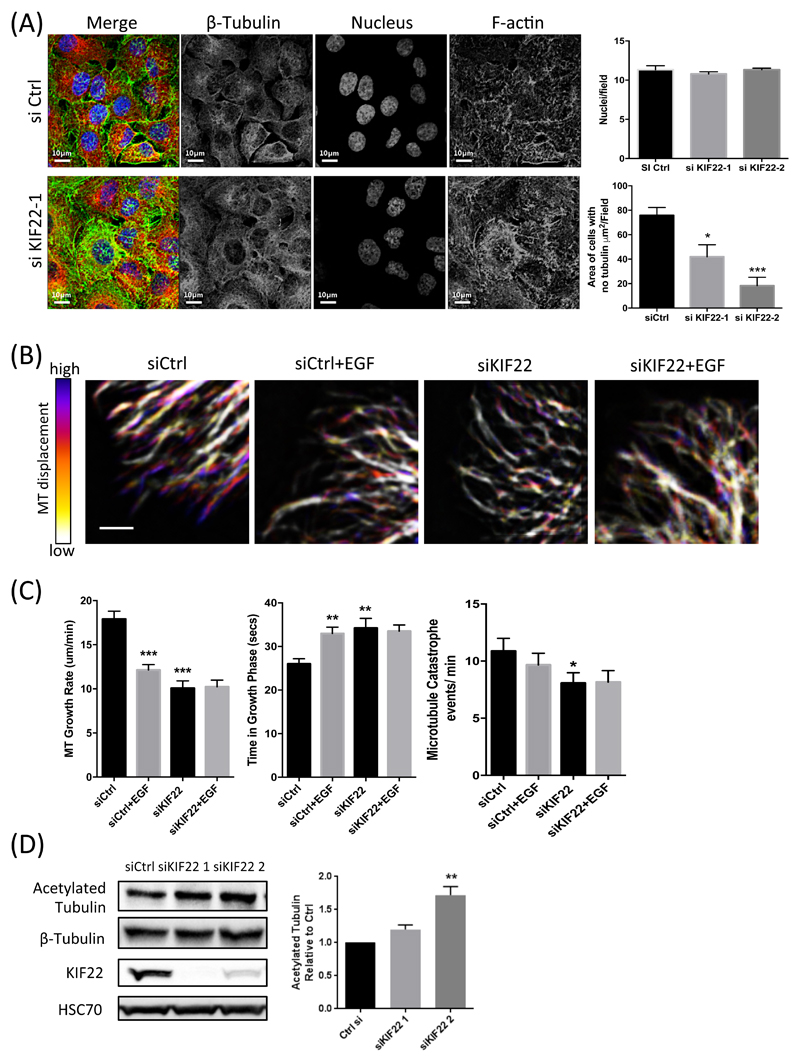
Figure 7. KIF22 regulates microtubule organisation and dynamics in cells in interphase.
(A) Representative examples of confocal images of control or KIF22-KD A549 cells, fixed and stained for DAPI (nucleus; blue), β-tubulin (red) or F-actin (phalloidin; green). Scale bars are 10µm. Graphs show number of nuclei per field and area of cells with no tubulin staining present represented as area (µm2/field). Data are mean ± SEM pooled from 9 fields per condition across 3 independent experiments. *p<0.01; ***p<0.001. (B) Representative example images from time-lapse movies of GFP-tubulin expressed in control or KIF22-KD A549 cells after stimulation with EGF. Time-dependent changes are depicted as color scales from time-projected stacks in which blue represents regions of highly dynamic microtubule (MT) growth and white denotes regions of static or disassembling microtubules. Scale bar is 2 µm. (C) Analysis of microtubule growth rate (µm/min), time spent in growth phase (secs), and catastrophe events per min in control or KIF22-KD cells, with and without EGF (10ng/ml). Data are mean ± SEM pooled from 22 cells total across 2 independent experiments. **p<0.005, ***p<0.001. (D) Representative western blot of acetylated tubulin in control and KIF22-KD cells. Data on right are mean ± SEM from 4 independent experiments. **p<0.005. All data was analyzed for statistical differences using 2-way ANOVA.

