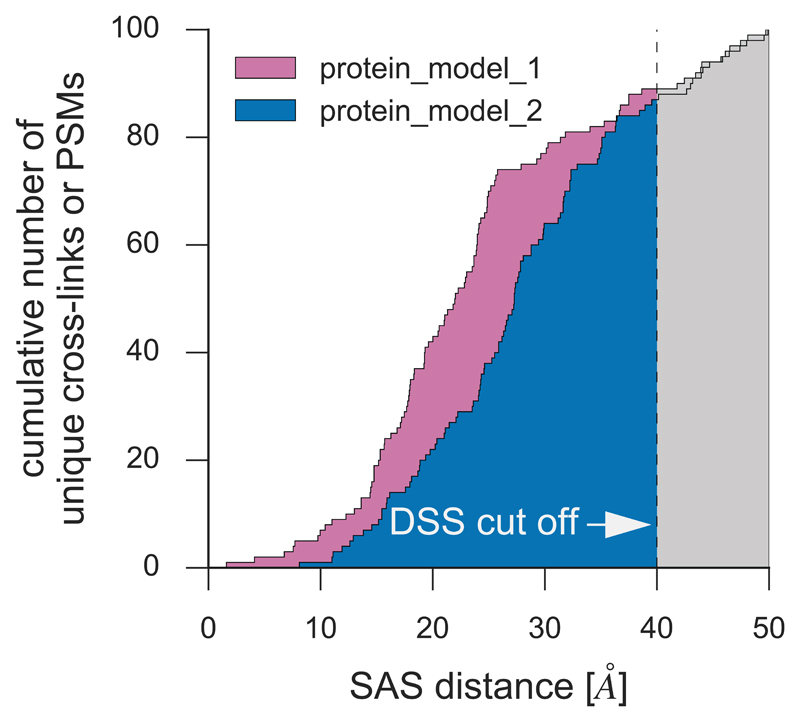
Figure 8. Simulated distribution of alpha-carbon distances between cross-linked residues in two resulting comparative models.
The plot depicts the cumulative number of DSS-derived cross-links that have an SASD less than or equal to a specified distance. Comparison of the plots for different structures (e.g. by calculating the normalized area under the resulting curve below a defined cut off value) facilitates best model selection at the evaluation step of the modeling workflow.

