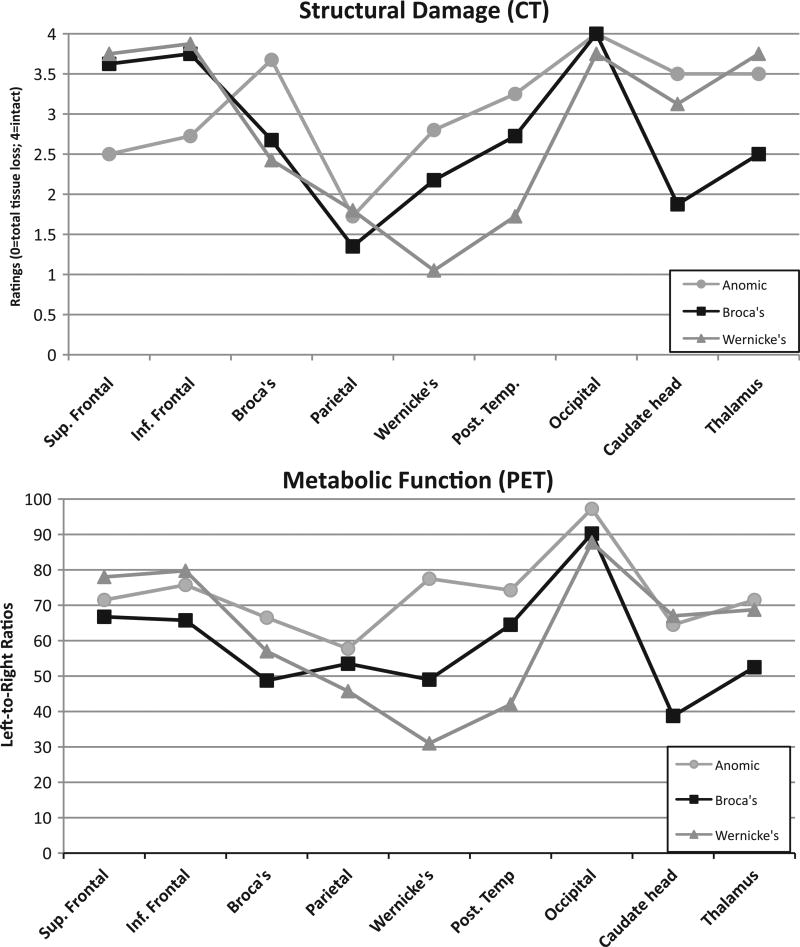
Figure 1.
(a) Structural damage (CT). Mean ratings for nine brain regions for each diagnostic group on a five-point scale (4 = normal, 3 = atrophy, 2 = damage with no tissue loss, 1 = damage with partial tissue loss, and 0 = damage with complete tissue loss). (b) Metabolic Function (PET). Metabolic measures for nine brain regions in three patient groups, derived using a comparison of metabolism in homologous regions of the left and right hemisphere for each patient, resulting in a left/right ratio. A higher number indicates greater symmetry between the damaged left hemisphere and the undamaged right hemisphere, and therefore more normal function.

