
Fig. 6.
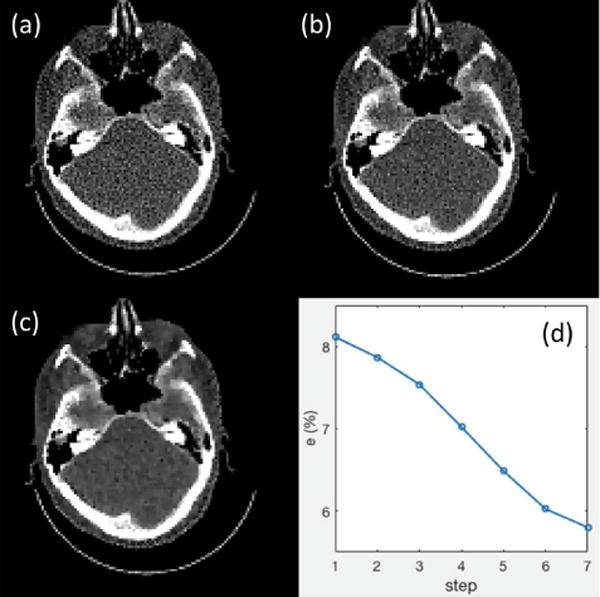
(a)-(c) Reconstructed images at step 1, 4, and 7. CT images are displayed in the window [−100, 300] HU. (d) Error e(%) as a function of parameter-tuning step.
Official websites use .gov
A
.gov website belongs to an official
government organization in the United States.
Secure .gov websites use HTTPS
A lock (
) or https:// means you've safely
connected to the .gov website. Share sensitive
information only on official, secure websites.
(a)-(c) Reconstructed images at step 1, 4, and 7. CT images are displayed in the window [−100, 300] HU. (d) Error e(%) as a function of parameter-tuning step.