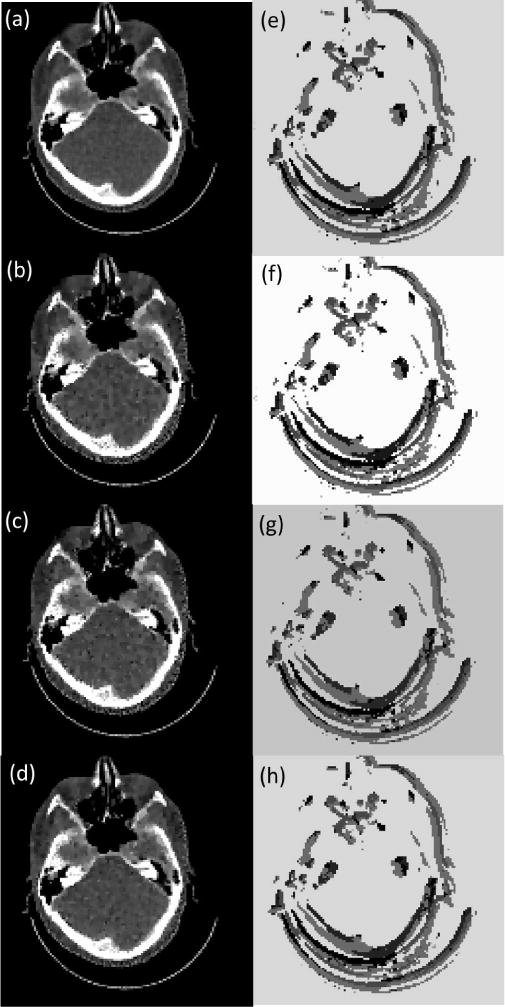
Fig. 9.

(a)-(b) The results under tuned parameter for a case with 2% and 5% noise in the projection data. (c) The result with 90 projections. (d) The result with isocenter-to-detector distance changed to 25 cm. CT images are displayed in the window [−100, 300] HU. Figures in the right column are tuned parameter maps displayed in log10 scale for corresponding figures in the left column.
