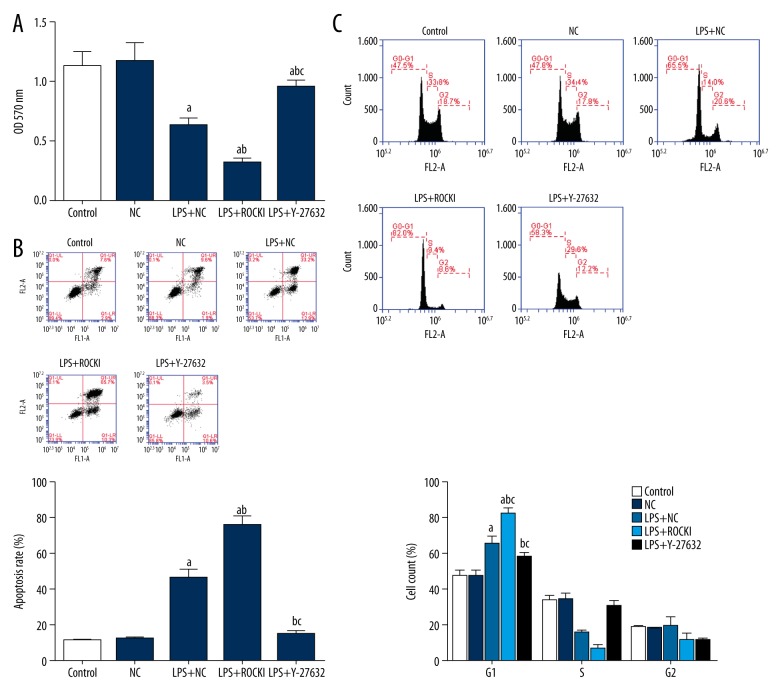
Figure 2.
Influence of ROCK1 on the cell viability, apoptosis, and cell cycle distribution of LPS-treated HCECs. (A) MTT assay. (B) Flow cytometry: apoptotic rates. (C) Flow cytometry, cell cycle distribution. a p<0.05 versus NC group; b p<0.05 versus LPS+NC group; c p<0.05 versus LPS+ROCK1 group. Each assay was represented by three replicates and data were expressed as mean ± standard deviation.

