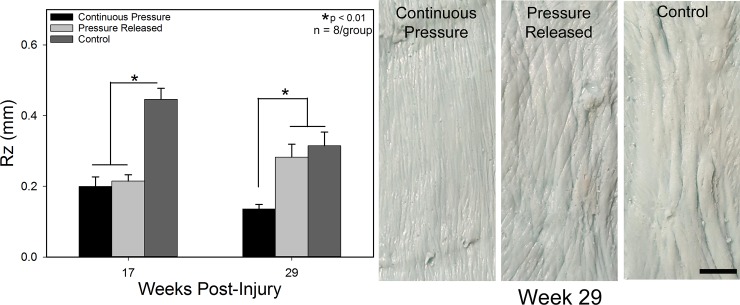
Fig 5. Scar roughness (Rz) as a function of time and treatment.
Groups which received PGT were significantly smoother than controls at week 17. Cessation of PGT resulting in an increase in surface roughness versus the continuous pressure group. Photographs of scar replicas at week 29 (Right) illustrating the differences in surface texture. Scars treated with continuous PGT were comprised of very fine wrinkles whereas the released and control groups had much larger scale roughness. All images at the same magnification. Scale bar = 1 cm. N = 8 per group.

