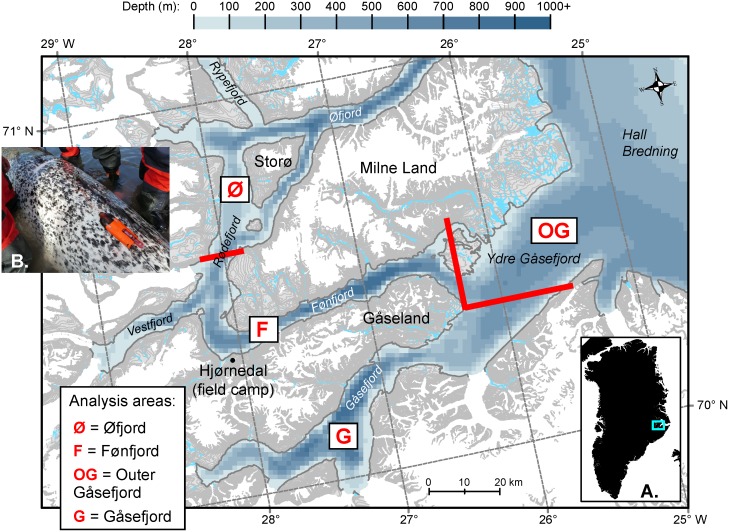
Fig 1. Detail of study area in Scoresby Sound, East Greenland, as shown in (A) with the turquoise rectangle.
The four sub-areas used in the statistical analyses are delimited by the thick red lines: Øfjord (Ø) to the northwest; Fønfjord (F), which includes the tagging area and the fjord along the southwestern shore of Milne Land; Gåsefjord (G), the large fjord south of Gåseland; and Outer Gåsefjord (OG), where Gåsefjord broadens and merges into Hall Bredning, at the widest part of Scoresby Sound. (B) Acousonde on female Freya, 8 Aug. 2013 (picture by MP Heide-Jørgensen). The map was generated with ArcGIS using bathymetric data from the International Bathymetric Chart of the Arctic Ocean (IBCAO) and coastline data from the Geological Survey of Denmark and Greenland (GEUS) [19].

