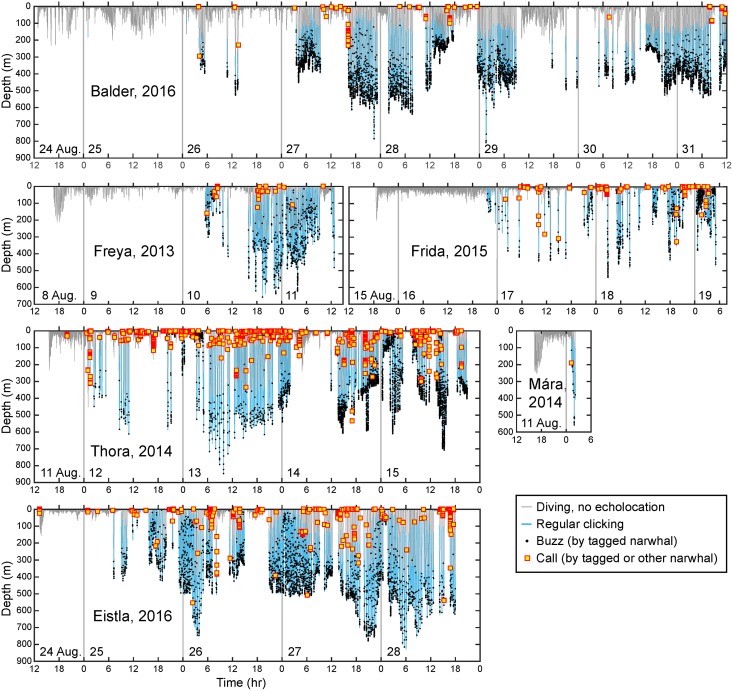
Fig 3. Dive depth as a function of time (gray lines) for all instrumented whales in 2013–2016.
Periods of echolocation by the tagged whale are shown in blue and each buzz is indicated by a black dot. The red-edged yellow squares show calls made either by the whale carrying the tag or other whales nearby (see text for more information).

