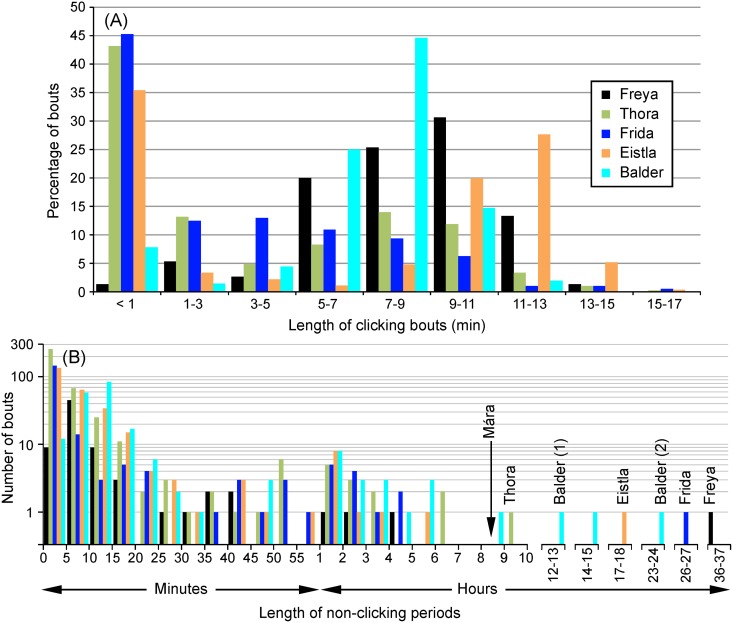
Fig 4. Histograms of the length of clicking and non-clicking periods, for all records but Mára’s.
(A) Percentage distribution of clicking bouts. Each bin on the x-axis is 2 min wide except for the first one (<1 min). (B) Number of click-free bouts of various durations. The y-axis above 1 is logarithmic because of the range of values. Bins on the x-axis have a width of 5 min from 0–60 min, then a width of 1 hour from 1–37 h. Bins above 10 h are non-continuous and are only shown if they contained data. The whales’ names are placed above the first click-free bout of each record, following release. Two bouts [(1) and (2)] are shown for Balder, since he used echolocation for 23 s about 12 h after release, following which he was silent for another 24 h. The vertical arrow shows the length of the non-clicking period following Mára’s release (her data were not otherwise included in these plots).

