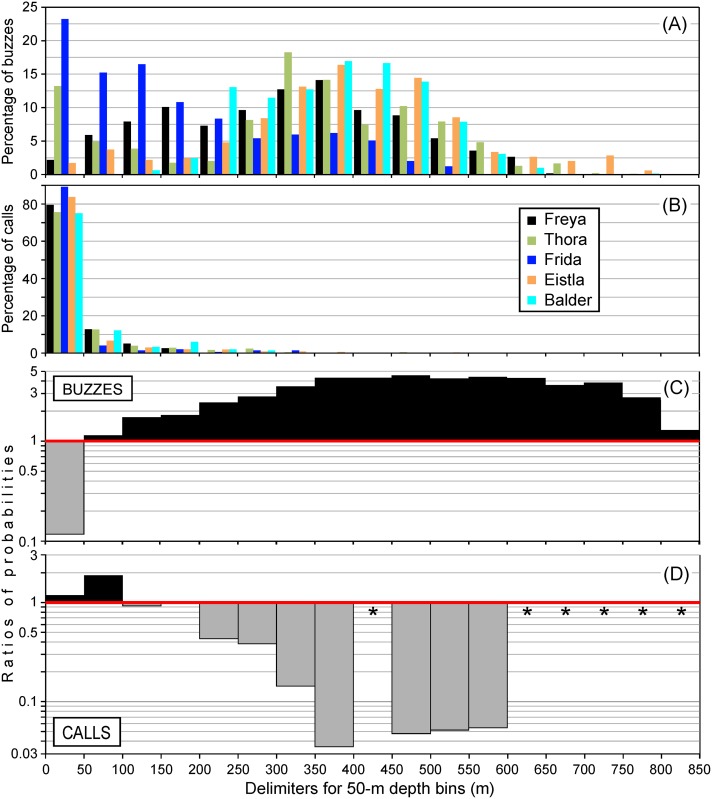
Fig 5. Preferential depths for buzz and call production, for 17 50-m depth bins encompassing the range of depths visited by the whales (all but Mára).
(A) Depth distribution of buzzes produced by the tag-bearer. (B) Depth distribution of calls detected in the acoustic records. All calls detected were included, i.e., calls made by the tag-bearer as well as other nearby whales. (C) and (D) show ratios of probabilities for (C) buzzes and (D) calls, for the combined records. (See text for more information.) Ratios >1, shown in black, indicate a higher-than-expected rate of buzzing or calling, while ratios <1, shown in gray, indicate a lower-than-expected rate. The star symbols indicate depth bins that did not include any calls, so for which ratios of probabilities could not be calculated.

