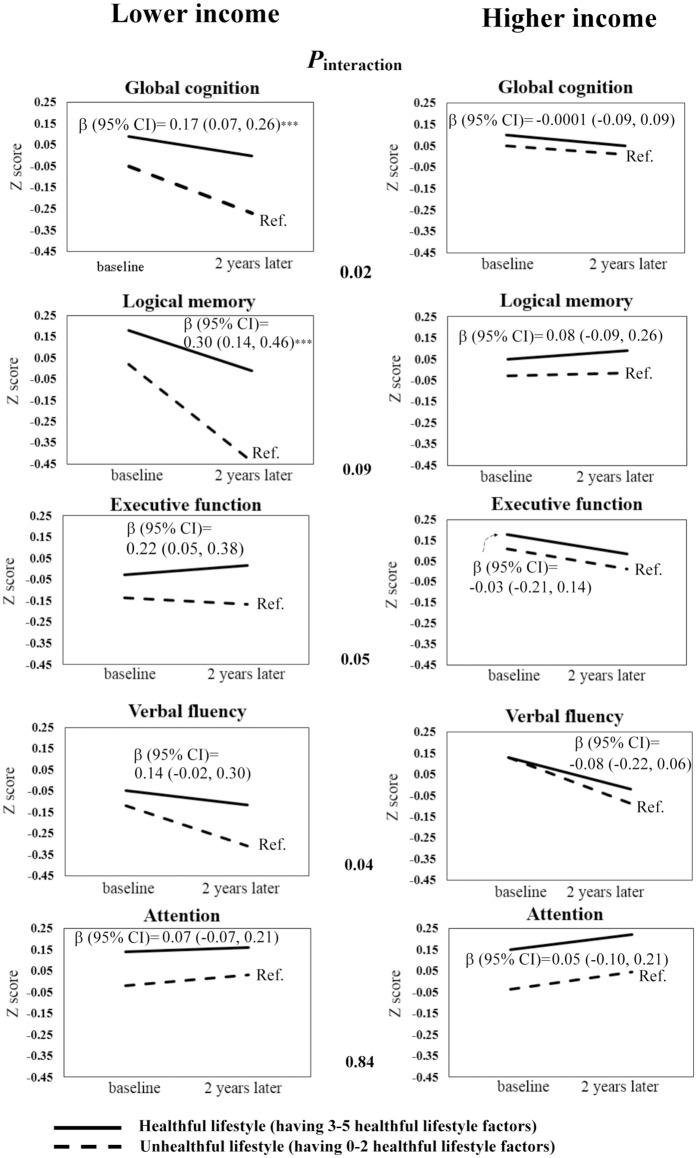
Fig 1. Interactions between a healthful lifestyle and annual household income on cognitive change.
Pinteraction is presented in the middle of the figure. After stratification by annual household income, the effects of having a healthful lifestyle compared with an unhealthful lifestyle are shown as β-coefficients (95% CI) above the solid lines after adjustment for age, sex, number of years of education, APOE ε4 status, baseline cognitive domain score, CES-D score, hypertension, diabetes mellitus, stroke, daily energy intake, and occupational complexity. The solid lines represent the cognitive change values for participants with a healthful lifestyle (having ≥ 3 healthful lifestyle factors), whereas the dashed lines represent individuals with an unhealthful lifestyle (having 0–2 healthful lifestyle factors). CI = confidence interval; Ref. = reference group. ***P < 0.001.

