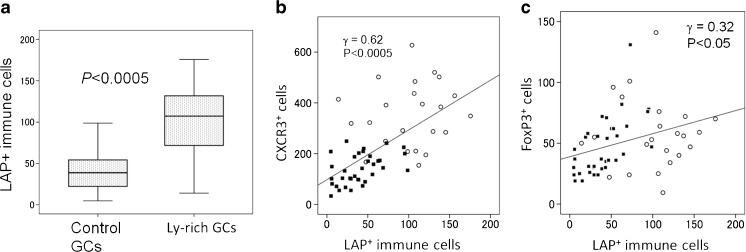
Fig. 2.
Quantification results of LAP (TGFβ1)+ immune cells. In control GCs, areas with the densest distribution were analyzed. a The number of LAP (TGFβ1)+ immune cells are larger in Ly-rich GCs than in control GCs. Box-whisker plots. Vertical line, the number of cells in one unit area (one lattice in a × 400 field, 0.0625 mm2). P values tested by Mann-Whitney U test. b, c Results of correlation analyses. The number of LAP (TGFβ1)+ immune cells correlated strongly with that of CXCR3+ cells (b), and weakly with FoxP3+ Treg cells (c) in all GCs. Open circles, Ly-rich GCs. Black boxes, control GCs. Vertical line, the number of immunoreactive immune cells in one unit area (one lattice in a × 400 field, 0.0625 mm2). Statistical analysis by Spearman’s test

