Fig. 5.
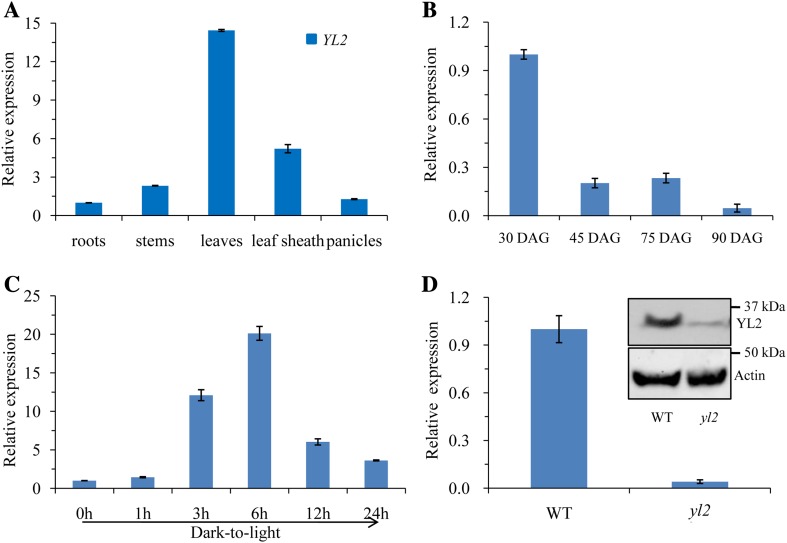
YL2 expression analysis. a qRT-PCR analysis of YL2 expression in roots, stems, leaves, the leaf sheath, and panicles at the booting stage. b mRNA levels of YL2 in leaves at each developmental stage. The YL2 mRNA level in the first leaf of wild-type (WT) plants at 30 days after germination (DAG) was set at 1.0. c qRT-PCR analysis of YL2 expression during greening of etiolated seedlings. WT seeds were germinated and grown in the dark for 10 days. Etiolated seedlings were then illuminated for 0 (control), 1, 3, 6, 12, and 24 h under normal light conditions. d Significantly reduced expression levels of YL2 in the yl2 mutant. The inserted image represents immunodetection of YL2 protein in WT and yl2 mutant plants. The YL2 transcript level was normalized to actin gene transcript as a control (LOC_Os03g50885). Data represent means ± SD (n = 3)

