Figure 3.

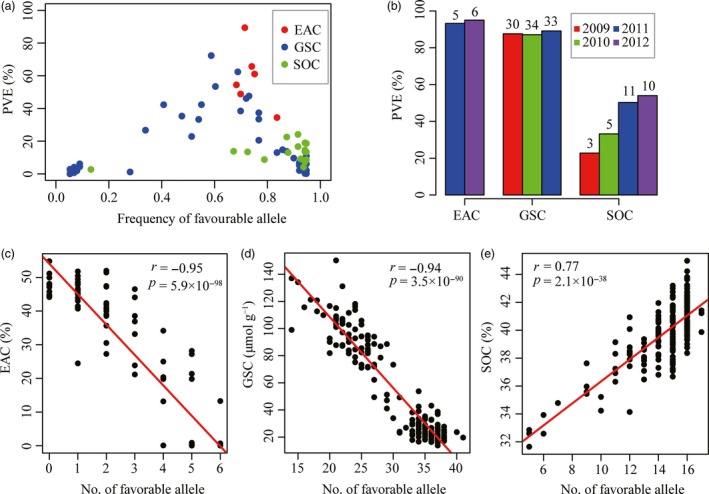
Characterization of PVE and favourable allele of associated loci for three traits. (a) The frequencies of favourable alleles and corresponding PVE. The favourable alleles of each loci for EAC and GSC were that reducing EAC and GSC in seeds, respectively. The favourable alleles of each loci for SOC were that increasing SOC. (b) Total PVE of all significant loci for three traits across each environment. Numbers on top of each bars indicated the number of loci detected in each year. (c‐e) Correlation between favourable allele number and EAC, GSC and SOC, respectively.
