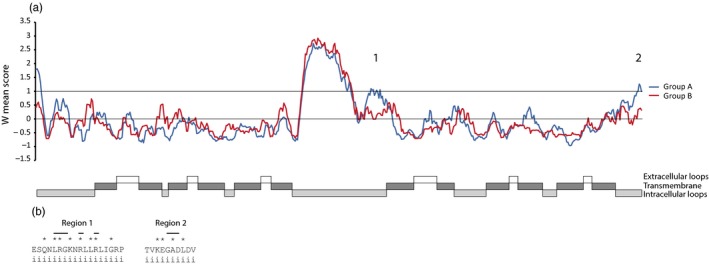
Figure 5.

Reverse conservation analysis of family 2.A.1.2.33 MFS transporters. (a) Amino acid conservation was estimated using Rate4Site, based on a MUSCLE alignment of hypocrealean MFS transporters, and plotted as W mean scores (based on S scores for individual positions) in arbitrary units. The blue and red lines represent the A and B clades indicated in Figure 3, respectively. Regions with signs of functional divergence (W ≥ 1 in one group and W < 0.5 in another group) are indicated. Transmembrane helices and loop structures were predicted with HMMTOP and displayed. (b) Amino acid sequences of regions (indicated by horizontal lines) with signs of functional divergence. Positions with high amino acid diversity (S score ≥ 1) are indicated by asterisks. Amino acid positions forming parts of intracellular loops are indicated by i
