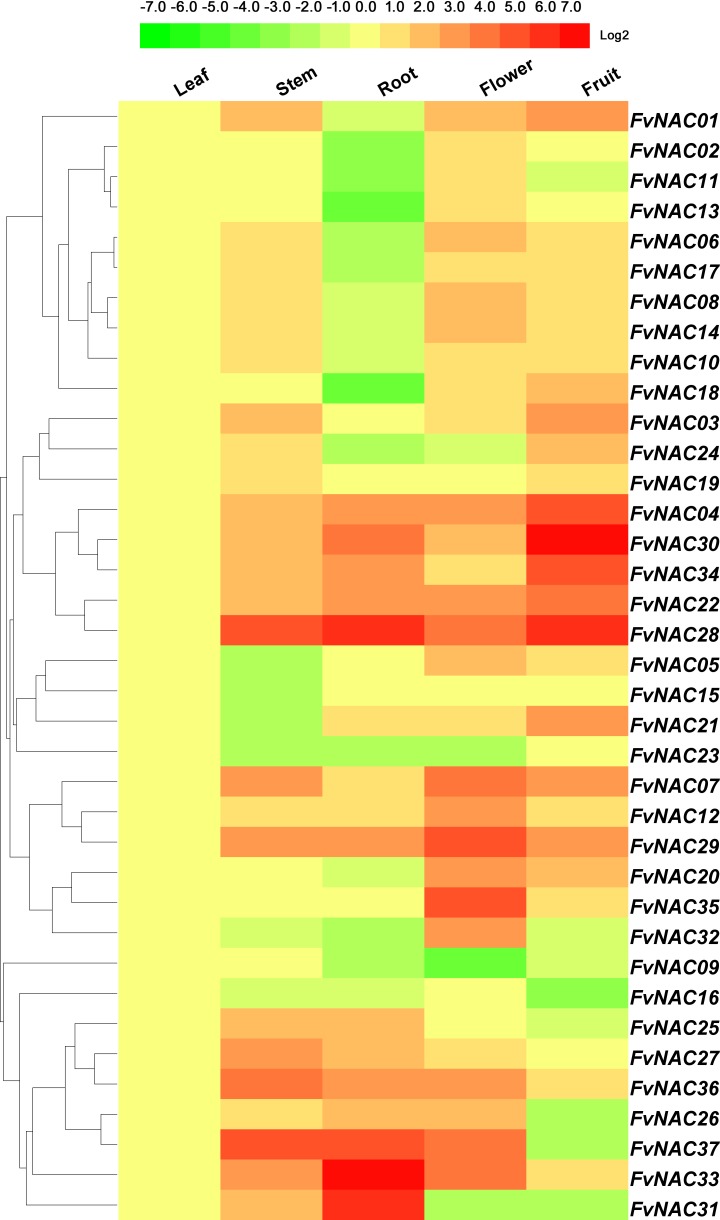
Fig 3. Expression profiles of FvNAC genes in different organs of the woodland strawberry.
The expression profiles were generated by qRT-PCR and visualized as heat map. The heat map was constructed using HemI 1.0 software. The color scale represents log2 expression values, with green indicates low expression and red indicates high expression.

