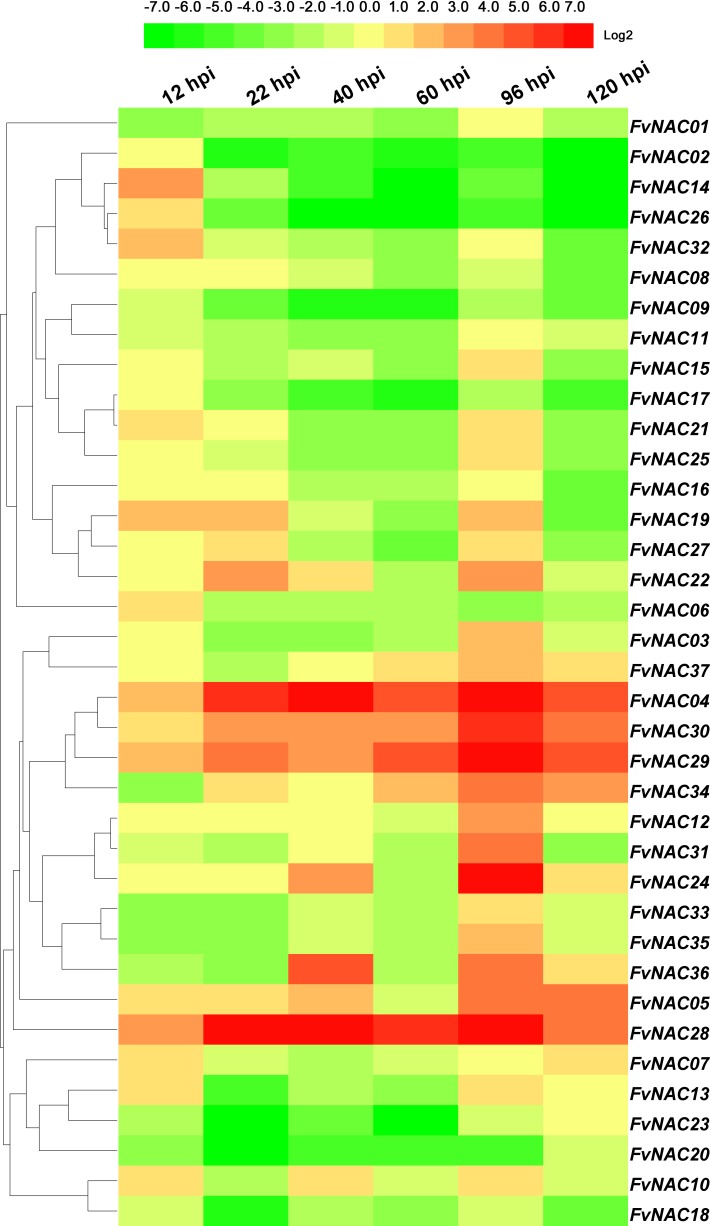
Fig 12. Expression profiles of FvNAC genes in leaves under C. gloeosporioides infection.
The C. gloeosporioides infection stress was performed by spraying the conidiospores (1×10⁶ conidiospores/mL) to woodland strawberry leaves surface. Log2 based values from cold stress of qRT-PCR data were used to create the heat map.

