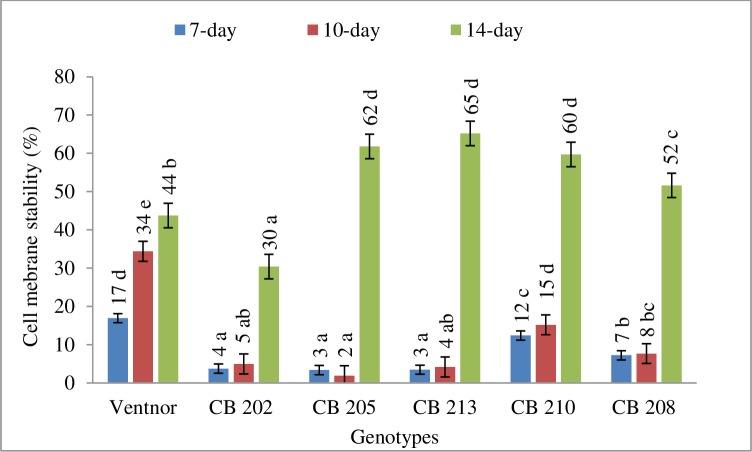
Fig 3. Cell membrane stability (averaged across years) presented as percent (±SE) of control plants at 7-, 10-, 14-day after heat treatment.
Plasmamembrane damage was estimated at 7 and 14 days after heat stress in year 1, while at 7 and 10 days after heat treatment in year 2. Bars representing mean values with same alphabets on the top are not significantly different (P<0.05) by Tukey's HSD test at a particular time of measurement.

