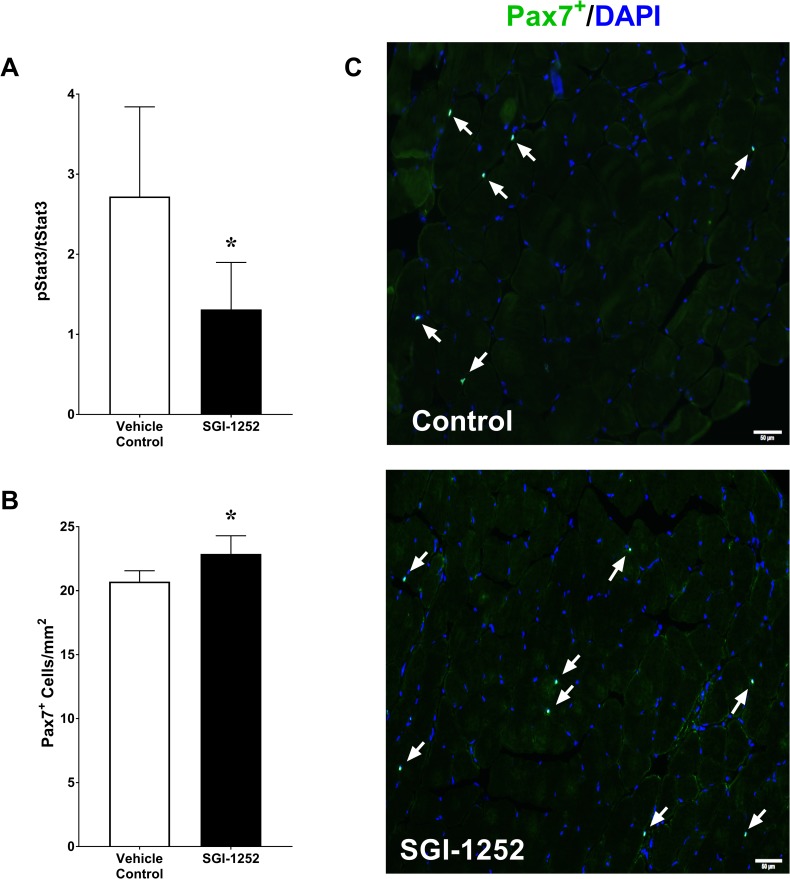
Fig 4. STAT3 and satellite cell concentrations.
(A) Phosphorylated-STAT3 displayed as a percentage of the total STAT3 concentration. (B) Histological quantification of Pax7+ satellite cells per volume of tissue with a (C) representative image from control and SGI-1252 treated mice. White arrows indicate the location of Pax7+ cells. Scale bar = 50 μm. * Significance p < 0.05.

