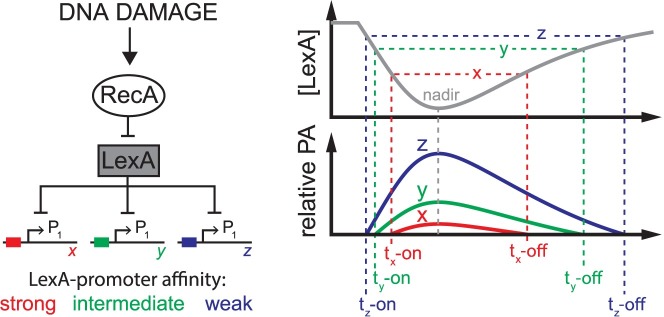
Fig 1. Thermodynamic equilibrium model of LexA occupancy at SOS promoters.
Left: RecA/LexA regulation of the SOS gene network in response to DNA damage. LexA represses transcription at hypothetical SOS gene promoters, x, y, and z, of similar promoter strengths, but with relatively strong (red), intermediate (green), or weak (blue) binding affinity for LexA. Right: After DNA damage, the LexA concentration (gray line) falls, reaches a nadir, then re-accumulates after DNA repair. In this model, the LexA-promoter binding reaction is in thermodynamic equilibrium with falling and rising LexA levels, therefore, the relative promoter activities of x, y, and z are dependent on promoter binding affinity for LexA, as defined by the equilibrium binding constant, Kd. Horizontal dotted lines indicate threshold concentrations of LexA at which the promoters achieve the identical promoter activity level (arbitrarily defined here as the y-intercept value of the x-axis). As LexA levels fall or rise, the time at which this promoter activity level is reached, t-on or t-off, respectively, is different for each promoter and indicated by the colored vertical dotted lines. The grey dotted line indicates the time of the LexA nadir. Given conditions of thermodynamic equilibrium for LexA binding at the promoters, the model predicts the time of peak promoter activity will correspond to the time of the LexA nadir for all promoters and that the first promoters to turn on will be the last to turn off (first-on last-off pattern). The limitations of this equilibrium model are discussed in the text and stand in contrast to the kinetic model (see Fig 7).

