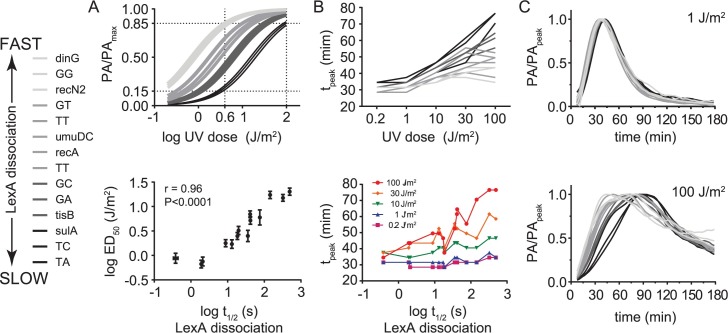
Fig 6. Effect of DNA damage dose on synthetic recA promoters.
A. Top: Normalized dose-response curves for synthetic recA promoters. Bottom: Correlation between the UV-activation thresholds (ED50) derived from the dose-response model and LexA-operator dissociation rates (t1/2). B. Top: Plot of tpeak versus UV dose for synthetic recA promoters. Bottom: Plot of tpeak versus LexA-operator dissociation rate (t1/2) for each UV dose. Lines connecting data points from different UV doses (top) or t1/2 values (bottom) are shown for ease of visualization. C. Normalized promoter activity traces at UV doses of 1 J/m2 (top) and 100 J/m2 (bottom). Legend: Data lines with darker shading indicate slower LexA-operator dissociation rates (larger t1/2).

