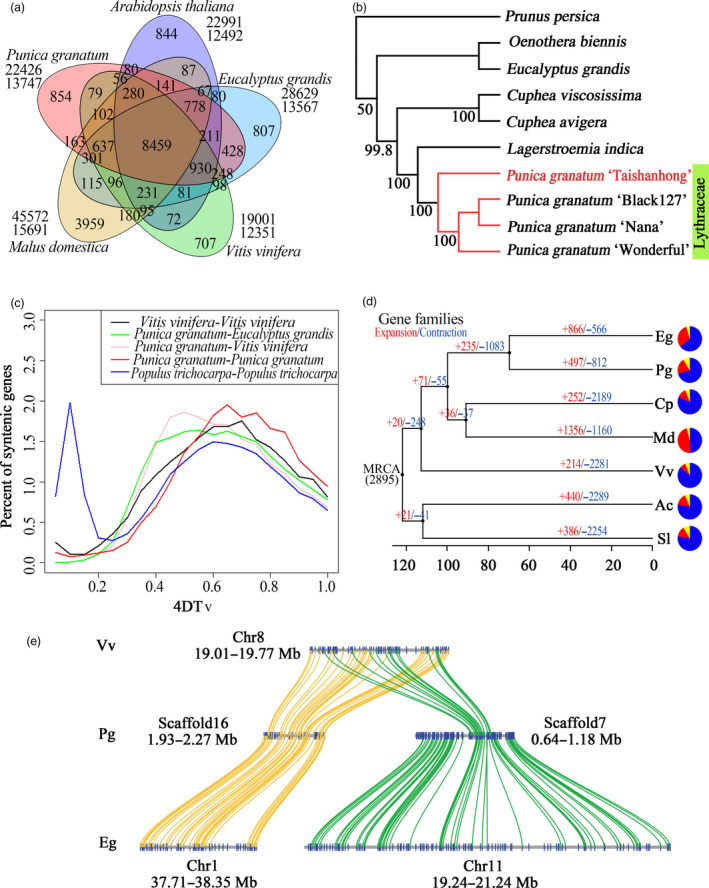
Figure 2.

Comparative genomic analysis of pomegranate and other eudicot species. (a) Venn diagram of shared orthologous gene families in pomegranate, Eucalyptus grandis, Malus domestica, Vitis vinifera and Arabidopsis thaliana. The gene family number is listed in each component. (b) Phylogenetic tree constructed from 106 single‐copy gene families. (c) Distribution of the 4DTv distance between syntenically orthologous genes. (d) Gene family expansion and contraction analysis. MRCA, most recent common ancestor. Gene family expansions and contractions are indicated by numbers in red and blue, respectively. Blue and red portions of the pie charts represent the contracted and expanded gene families relative to MRCA, respectively, while the grey portions represent the conserved gene families. (e) Schematic diagram of large‐scale duplication events.
