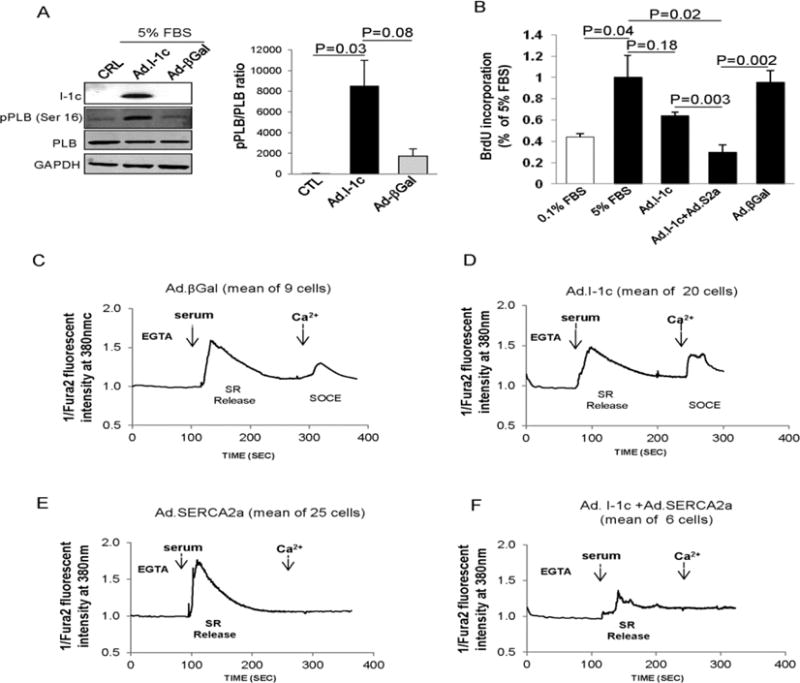
Figure 4.

Effect of I-1c overexpression on hCASMC. (A) Immunoblot analysis (left panel) for indicated proteins and relative quantification of pPLB expression (right panel) in hCASMCs infected with the indicated adenovirus (B) Effect of Ad.I-1c, Ad.βGal, and Ad.I-1c together with Ad.SERCA2a on hCASMC proliferation. Cells were infected with the aforementioned virus for 48h and then cultured for 48h in virus-free BrdU in 5% FBS medium. Bars represent the mean ± SEM of BrdU incorporation of 4 independent experiments. Data are expressed as a percentage of control cells cultured in 5% FBS. Values represent mean ± SEM. (C–F) Analysis of I-1c overexpression on Ca2+ transients in synthetic hCASMCs. Intracellular Ca2+ imaging recorded in FURA-2 loaded cells representative of 3 experiments obtained from 3 independent infections. Cells were infected with Ad.βGal (C) Ad.I-1c (D), Ad.SERCA2a (E) or both Ad.I-1c and Ad.SERCA2a (F) for 2 days and then cultured for 24h in virus-free and serum-free medium before Ca2+ transient recording. Fluorescence intensity was only recorded in response to one excitation wavelength (380 nm). Traces represent the mean of several cells recordings. To record SR Ca2+ release and SOC activation, cells were treated with 5% serum buffered with EGTA in absence of extracellular Ca2+ (EGTA, 100μM); extracellular Ca2+ (CaCl2, 300μM) was then added at the indicated time.
