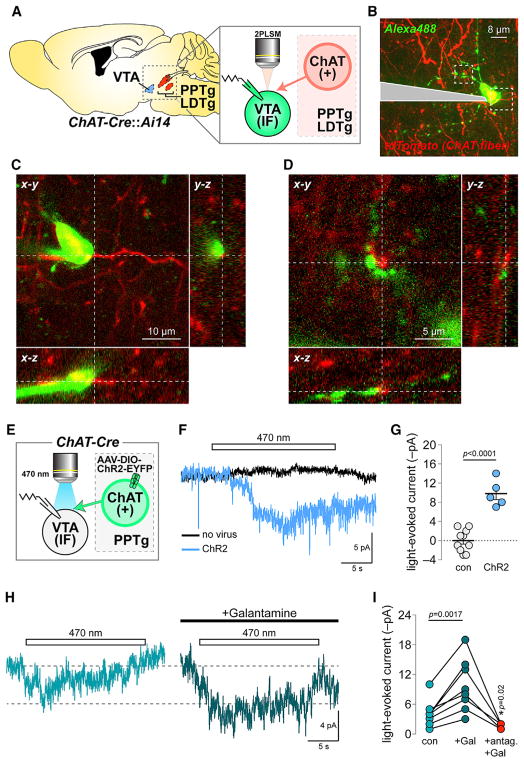
Figure 1. Medial VTA nAChRs Participate in Cholinergic Transmission.
(A) Imaging and recording configuration for (B)–(D).
(B) 2PLSM image of a dye-filled mVTA neuron and cholinergic fibers.
(C and D) Soma (C) and dendrites (D) from the cell in (B) shown proximal to cholinergic fibers. Representative of n = 4 cells/n = 3 mice.
(E) Approach used in (F)–(I).
(F) Voltage clamp current deflections during 470 nm light flashes (20 s) in slices from ChR2− versus ChR2+ mice. Averaged traces for five to ten cells shown.
(G) Light-evoked current amplitudes for (n = 9/2 and n = 5/2) neurons in control (no virus) and ChR2+ mice. (scatter plot with mean ± SEM). p value is from a two-sided unpaired t test.
(H) Averaged photocurrents (470 nm, 20 s flash) for neurons from ChR2+ mice ± galantamine (1 μM).
(I) Light-evoked current amplitudes for (n = 8/4) individual neurons before drug (con), during galantamine (Gal) application, and during co-application of galantamine + nAChR antagonist cocktail (10 μM DHβE, 100 nM α-Ctx MII, 10 nM MLA). p values are from two-sided paired t tests.
See also Figure S1.

