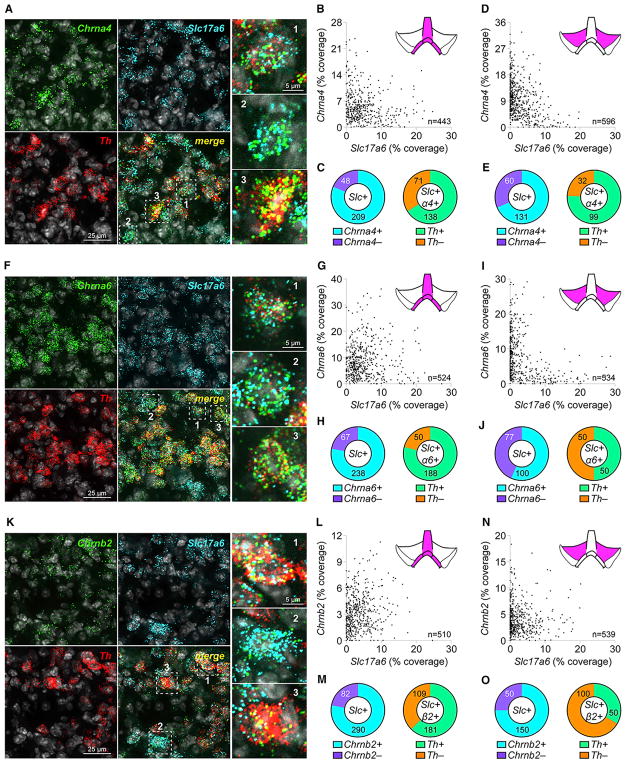
Figure 2. VTA Glutamate Neurons Express Heteromeric nAChRs.
(A–E) Co-expression of (mRNA) Chrna4 and (mRNA) Slc17a6 in VTA neurons.
(A) Fluorescence in situ hybridization (FISH) in mVTA neurons for probes: Chrna4, Slc17a6 (VGLUT2), and Th. Chrna4+ neurons indicated in “merge” panel and shown enlarged (right), were (1) Chrna4+/Slc17a6+/Th+, (2) Chrna4+/Slc17a6+/Th−, and (3) Chrna4+/Slc17a6−/Th+.
(B) Scatterplot of Slc17a6 (abscissa) and Chrna4 (ordinate) “% coverage” for all analyzed neurons.
(C) Left: pie graph of Slc17a6+ neurons that were Chrna4+ versus Chrna4−. Right: Th expression for Slc17a6+/Chrna4+ neurons from left pie graph.
(D and E) Chrna4/Slc17a6 co-expression in lateral VTA was performed as in mVTA (B and C).
(F–J) Co-expression of (mRNA) Chrna6 and (mRNA) Slc17a6 in VTA neurons.
(F) Fluorescence in situ hybridization (FISH) in mVTA neurons for probes: Chrna6, Slc17a6 (VGLUT2), and Th. Chrna6+ neurons indicated in ‘merge’ panel, and shown enlarged (right panels), were: 1) Chrna6+/Slc17a6+/Th+; 2) Chrna6+/Slc17a6+/Th−; 3) Chrna6+/Slc17a6−/Th+.
(G) Scatter plot of Slc17a6 (abscissa) and Chrna6 (ordinate) ‘% coverage’ for all analyzed neurons.
(H) Left: Pie graph of Slc17a6+ neurons that were Chrna6+ vs. Chrna6−. Right: Th expression for Slc17a6+/Chrna6+ neurons from left pie graph.
(I and J) Chrna6/Slc17a6 co-expression in lateral VTA was performed as in mVTA (G and H).
(K–O) Co-expression of (mRNA) Chrnb2 and (mRNA) Slc17a6 in VTA neurons.
(K) Fluorescence in situ hybridization (FISH) in mVTA neurons for probes: Chrnb2, Slc17a6 (VGLUT2), and Th. Chrnb2+ neurons indicated in ‘merge’ panel, and shown enlarged (right panels), were: 1) Chrnb2+/Slc17a6+/Th+; 2) Chrnb2+/Slc17a6+/Th−; 3) Chrnb2+/Slc17a6−/Th+.
(L) Scatter plot of Slc17a6 (abscissa) and Chrnb2 (ordinate) ‘% coverage’ for all analyzed neurons.
(M) Left: Pie graph of Slc17a6+ neurons that were Chrnb2+ vs. Chrnb2−. Right: Th expression for Slc17a6+/Chrnb2+ neurons from left pie graph.
(N and O) Chrnb2/Slc17a6 co-expression in lateral VTA was performed as in mVTA (L and M).
Complete data for nAChR/Slc17a6 FISH are listed in Table S1. Data are pooled from n = 3 mice. See also Figure S2 and Table S2.

