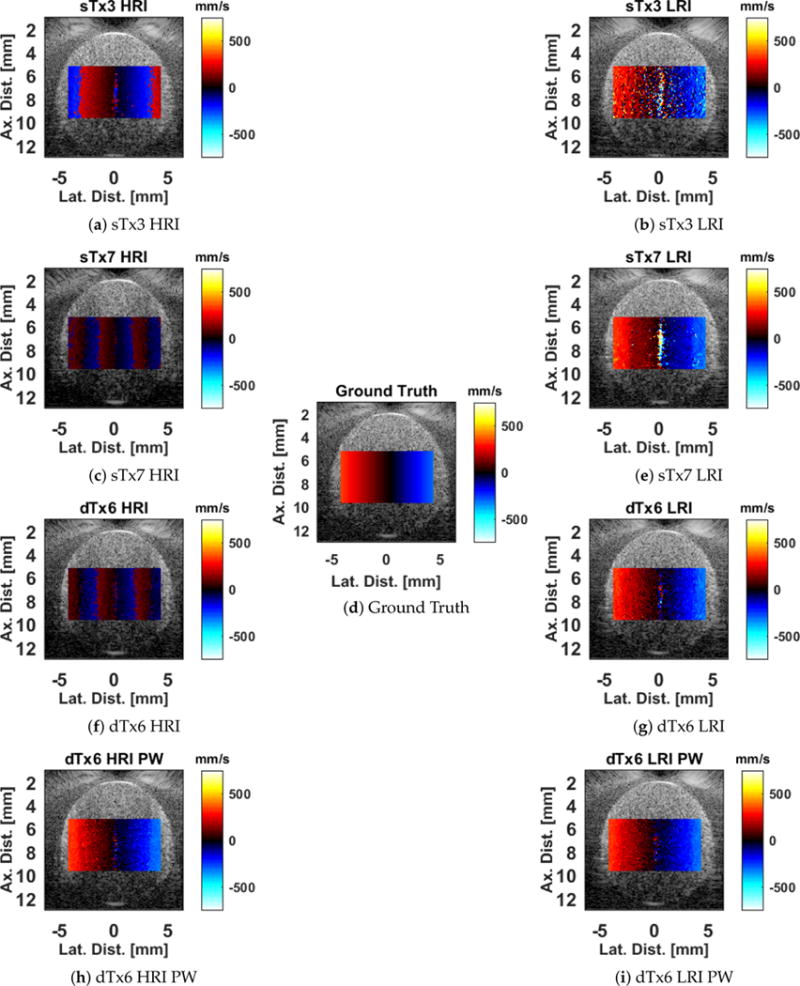
Figure A4.

Color flow Doppler images generated from the experimental data. The HRI images are shown on the left, and the LRI images are shown on the right, with each row corresponding to a different dataset. The pairwise results are shown in the last row. All images are rendered with the same color scale to facilitate easy comparisons. Aliasing is clearly observed in the traditional HRI cases, manifesting as banding artifacts. The high error observed in the center is due to the clutter filter, which attenuates slow-moving components of the signal. This confirmed in the power Doppler images (Figure A5), which exhibit deep notches in the center of the image, corresponding to stationary axial motion.
