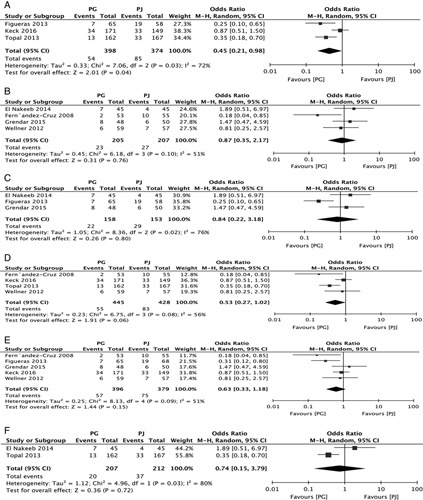
FIGURE 4.

Forest plot of the subgroup meta-analysis of the incidence of POPF according to the type of center (A and B); based on the type of PG (C and D); based on the type of PJ (E and F). CI indicates confidence interval; PG, pancreaticogastrostomy; PJ, pancreaticojejunostomy; POPF, postoperative pancreatic fistula.
