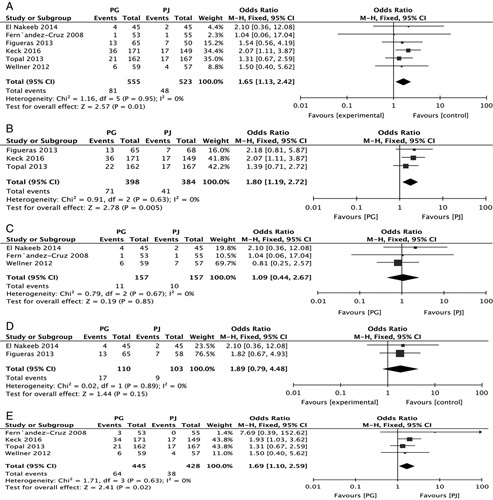
FIGURE 5.

Forest plot of the subgroup meta-analysis of the incidence of PPH (A); according to type of center (B and C); according to the type of PG (D and E). CI indicates confidence interval; PG, pancreaticogastrostomy; PJ, pancreaticojejunostomy; PPH, postpancreatectomy hemorrhage.
