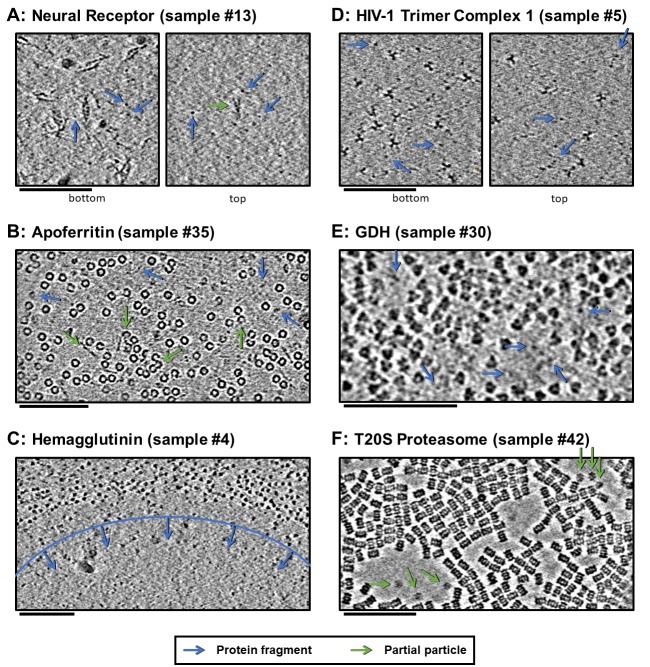
Figure 6. Slices of tomograms, about 10 nm thick, at air-water interfaces of samples that show clear protein fragments (examples indicated with blue arrows) and/or partial particles (examples indicated with green arrows), presented roughly in order of decreasing overall fragmentation.
(A) Neural receptor shows a combination of fragmented 13 kDa domains consisting primarily of β-sheets and partial particles. (B) Apoferritin shows apparent fragmented strands and domains along with partial particles. (C) Hemagglutinin shows a clear dividing line, marked with blue, where the ice became too thin to support full particles, but thick enough to support protein fragments. (D) HIV-1 trimer complex one shows several protein fragments on the order of 10 kDa; however, these might be receptors intentionally introduced to solution before plunge-freezing. (E) GDH shows protein fragments interspersed between particles. (F) T20S proteasome shows partial particles, determined by measuring their heights in the z-direction, on an otherwise clean air-water interface (see the end of Video 10 for sample #42). For the examples shown here, it is not clear whether the protein fragments and partial particles observed are due to unclean preparation conditions, protein degradation in solution, or unfolding at the air-water interfaces, or a combination; all cases are expected to result in the same observables due to competitive and sequential adsorption. Scale bars are 100 nm.

