
Figure 2.
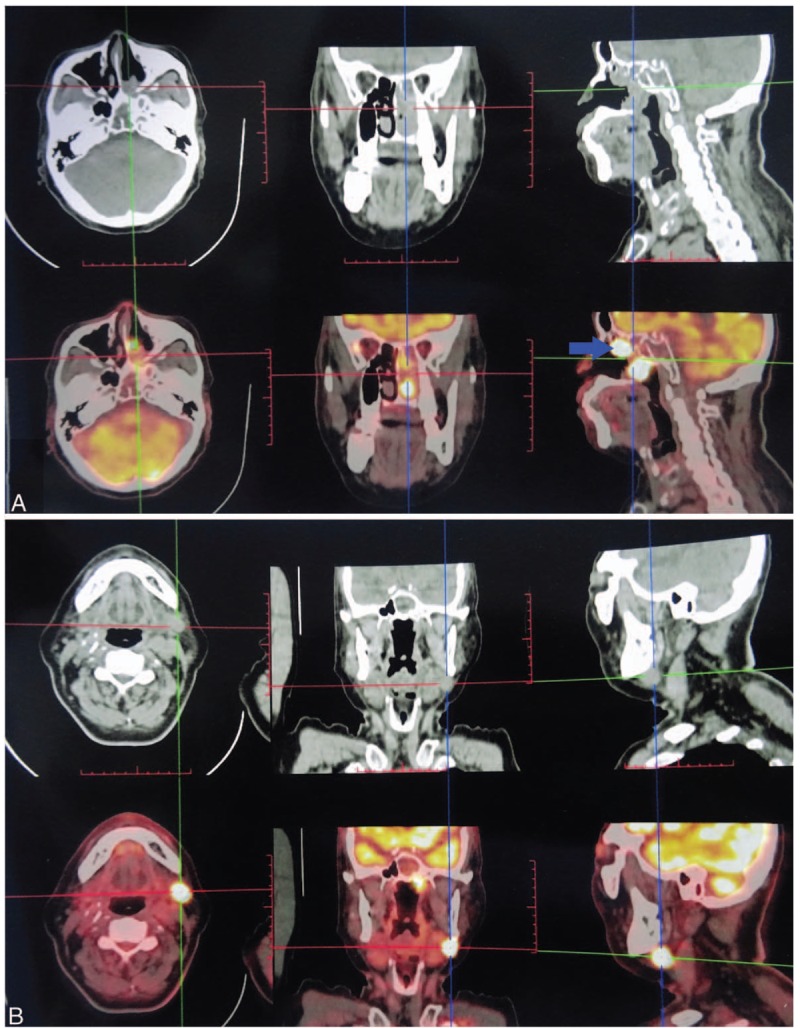
F-18 fluorodeoxyglucose-positron emission tomography/computed tomogramphy image before the fourth surgery. (A) The glucose metabolism of the left posterior nasal passages was increased (red arrow). The size of the mass was about 2.6 × 2.5 × 1.8 cm, and the density was not even. The CTavg was about 44 to 51 Hu and SUVmax 33 Hu. The radiation-uptake of the top of the left nasopharyngeal cavity was very thick; the size of the mass was about 2.5 × 2.4 × 1.7 cm, with CTavg about 45 to 53 Hu and SUVmax 45 Hu (blue arrow). (B) The enlarged lymph nodes in the left posterior mandible (black arrow) showed abnormal increase of glucose metabolism, about 2.2 × 2.0 × 1.8 cm and SUVmax 41 Hu. CTavg = computed tomography average value, SUVmax = maximum standard uptake values.