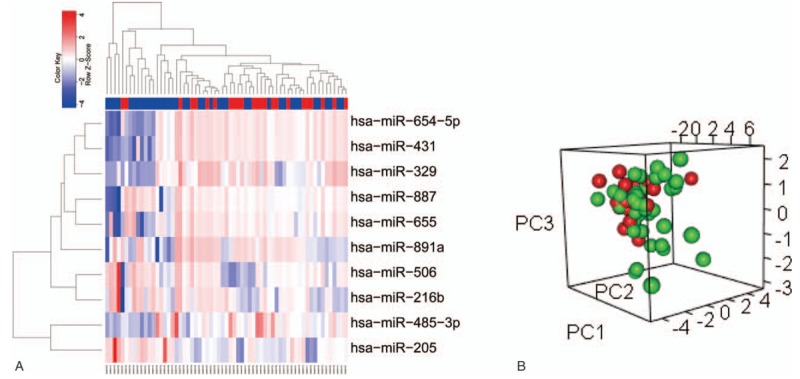
Figure 1.

Identification consensus DEGs screening of PM and OM in lung metastasis patients. (A) The 10 DE miRNAs PM (red label) versus OM (green label) of GSE38698 set. Each column is a sample and each row is the expression level of a miRNA. The color scale represents the raw Z-score ranging from blue (low expression) to red (high expression). Dendrograms beside each heatmap correspond to the hierarchical clustering by expression of the 10 DE miRNAs. (B) PCA plot showing complete, unsupervised separation of 63 array samples into 24 PM (red) and 39 OM (green) samples.
